Data Consolidation: Types, Methods, and Automation Strategies
by Kevin Wiegand
|May 11, 2026
|Xero
You probably know the moment well. Month-end is approaching. Sales data sits in the CRM, transactions live across multiple Xero entities, and inventory updates are scattered across three different spreadsheets. Data consolidation is the process that pulls all of this into one trustworthy view, so you spend less time chasing numbers and more time acting on them. This guide walks through the main types of data consolidation, the methods finance and BI teams use, and a clear way to decide between manual workflows and automation. By the end, you will know which approach fits your business and what to do next.
Quick Summary: Data Consolidation
Data consolidation combines information from multiple sources into a single repository so finance and BI teams can analyse, report, and reconcile from one place. It typically uses ETL or ELT pipelines, a data warehouse or lake as the destination, and an automated consolidation workflow for ongoing refresh. Teams we work with often reduce month-end close from over 15 days to under 5 by replacing manual spreadsheet rollups with this kind of automation.
Ready to Automate Your Financial Consolidation?
Stop wrestling with manual consolidations and broken formulas. dataSights automates multi-entity reporting, Xero consolidations, and Power BI connections. Join 300+ businesses already transforming their financial reporting with our platform, rated 5.0 out of 5 by 90+ verified Xero users.
Start Your Free 14-Day TrialTable of Contents
How Data Consolidation Differs From Integration and Aggregation
People use these three terms interchangeably. They are related but not identical, and the distinction matters when you scope a project.
- Data consolidation physically merges data from multiple sources into one centralised store, like a data warehouse. The goal is a single source of truth for analysis and historical reporting. Consolidation is one form of data integration, focused on a unified analytical store.
- Data integration is the umbrella term for combining data across systems. It includes consolidation as one pattern, alongside operational integration like a CRM updating an accounting system on each transaction, replication, and data virtualisation. Some integration patterns move data permanently, others share it in flight.
- Data aggregation summarises data into totals, averages, or counts for reporting. The goal is a digestible view, not a full dataset you can drill into.
A practical rule of thumb: consolidate when you need one analytical store with full history. Use a different integration pattern, like replication or messaging, when you only need operational systems to share data. Aggregate when you only need totals or averages.
The Main Types of Data Consolidation
Not every consolidation project looks the same. The data, the destination, and the standards differ by domain. We see three types come up repeatedly with the businesses we work with.
Operational and Transactional Data Consolidation
This covers:
- Sales
- Inventory
- Supply chain
- Production data pulled from:
- CRMs
- Warehouse management systems
- Manufacturing execution systems
The goal is usually a unified operational dashboard. Data volumes can be high and refresh cadence often needs to be daily or hourly, which pushes most teams toward automated pipelines rather than manual exports.
Customer and CRM Data Consolidation
This pulls together customer records from CRM, marketing platforms, e-commerce sites, and support systems to produce a single customer view. The hard part is identity resolution, where the same person appears as different IDs across systems. Without strong matching rules, you get duplicate records that distort lifetime value and churn calculations.
Financial and Accounting Data Consolidation
This is the type most relevant to multi-entity finance teams. You combine subsidiary trial balances into group accounts, eliminate intercompany transactions, translate foreign currency, and produce consolidated statements that present the parent and its subsidiaries as a single economic entity. Where control exists, IFRS 10 sets the framework, but compliance depends on professional judgement applied to control assessment and disclosures, not on automation alone. The accuracy bar is higher than in operational consolidation because the output goes to auditors, lenders, and the board. dataSights handles this for Xero groups through dedicated multi-entity reporting workflows.
Methods Used to Consolidate Data
A method is the technical approach you use to move and store data. Five methods cover almost every consolidation use case, sitting on a spectrum from heavy custom scripts to light query layers.
Hand-Coding: Custom Scripts for Bespoke Sources
Hand-coding means writing custom SQL, Python, or VBA scripts to extract, transform, and load data from each source. It is the oldest method and still common where finance teams have a strong SQL developer on staff.
Use hand-coding when:
- A source system has no off-the-shelf connector and the API has to be wrapped manually.
- You need full control over a one-off migration, data fix, or audit query.
- Volumes are small and the schema is unlikely to change often.
The trade-off is maintenance cost. Every new source means more code, every schema change breaks something, and the knowledge sits with the person who wrote it. In the finance teams we work with, the tipping point typically lands around three or four sources, where maintenance cost outweighs the control hand-coding gives you.
ETL: Transform Before You Load
ETL stands for extract, transform, load. You pull raw data from each source, clean and standardise it on a separate processing layer, then load the finished output into your destination.
- Data quality must be strict before it lands, such as in regulated finance or healthcare reporting.
- Datasets are smaller and the schema is well understood.
- Downstream uses are fixed and unlikely to change.
The trade-off is slower throughput on large datasets and less flexibility if you later want to slice the data differently.
ELT: Load Raw, Transform in the Warehouse
ELT flips the order. You extract and load raw data straight into the warehouse, then transform it inside the warehouse using SQL or a transformation tool.
Use ELT when:
- You have a modern cloud warehouse with elastic compute available.
- Data volumes are large and growing.
- Downstream use cases keep evolving and you want to keep raw data accessible.
ELT can shorten end-to-end latency for near real-time reporting, but actual speed depends on data volume, transformation complexity, and the compute you allocate.
A non-obvious point: many finance teams default to ETL because it sounds safer, then hit performance walls as group structures grow. For Xero groups with multiple entities and tight close windows, ELT into a managed warehouse usually wins because the warehouse parallelises transformation rather than serialising it on a separate layer.
Data Warehouses, Lakes, and Lakehouses
The destination matters as much as the pipeline. Three options cover almost every consolidation use case:
- Data warehouse: Stores cleaned, structured data optimised for reporting and SQL queries. Best for finance and management reporting where the schema is stable.
- Data lake: Stores raw data in its native format, including unstructured items like logs, PDFs, and images. Best for data science and machine learning workloads where flexibility matters more than performance.
- Lakehouse: Combines both. You get cheap raw storage plus warehouse-style query performance, at the cost of slightly more complex governance.
For most multi-entity finance teams, a managed warehouse is enough. dataSights gives every customer a dedicated Azure SQL database, which keeps each customer's consolidated dataset isolated and queryable through Excel, Power BI, or Google Sheets via pre-built connectors.
Data Virtualisation as a Lighter Alternative
Data virtualisation creates a unified view across systems without physically moving the data. It works well when source systems are already well-governed and you only need a query layer. It struggles when source data is messy, when you need a stable historical record, or when audit trails matter. For consolidated financial statements, virtualisation is rarely enough on its own.
To see how this works end-to-end for a Xero group, this short walkthrough covers automatic eliminations, management report packs, and Excel automation in one flow:
A Practical Process for Data Consolidation
Whether you build it yourself or buy a platform, the same five-stage process applies. In the multi-entity finance teams we work with, skipped stages account for a disproportionate share of consolidation projects that stall or get rebuilt.
- Data discovery: List every system that holds data you need to consolidate, the format it produces, and the refresh cadence you want. This stage flushes out unknown sources before they cause problems later.
- Mapping and standardisation: Decide how each field maps to the target schema, what units of measurement you will use, and how you will handle missing values. Date formats, currency codes, and entity identifiers cause the most rework when this stage is skipped.
- Extraction and transformation: Pull data from sources via APIs, file drops, or direct database connections, then clean and reformat it to match your target schema.
- Loading and validation: Load into the central store with validation rules that flag anomalies before they reach reports. Tie consolidated totals back to source on every run.
- Governance: Set access controls, data quality checks, and audit logging using guidance from the UK Government Data Quality Framework.

Financial Data Consolidation: A Worked Example
Generic process diagrams hide the parts that actually break consolidation. Across the Xero groups we onboard, intercompany eliminations are consistently the hardest piece to get right. Here is a small worked example using two Xero entities in a group.
Entity A sells £80,000 of services to Entity B during the month. Each entity records the transaction in its own books, typically as an invoice in Entity A and a bill in Entity B, or as matched journal entries. On consolidation, Entity A shows £80,000 of revenue and Entity B shows £80,000 of expense. If you simply add the entities together, the group income statement double-counts £80,000 because the group has not earned anything from itself. The correct treatment eliminates both lines, leaving the group accounts unchanged. Only the intercompany portion is removed, not the entire revenue or expense balance, which is a step that manual consolidation often gets wrong.
The same logic applies to intercompany loans and unrealised profit on inventory. A parent that lends £500,000 to a subsidiary at 5% interest sees the £500,000 loan balance and the £25,000 interest income and expense disappear on consolidation, because no cash has left the group. dataSights configures these elimination rules once during onboarding, then applies them automatically each refresh, with the underlying detail still visible for audit. You can see a full consolidated financial statements example of how this output looks in practice.
Common Mistakes and How to Avoid Them
In the consolidation projects we see, the issues that come up most often are not technical. They come from skipped checks and unclear ownership.
- Trusting source data without profiling: Run column-by-column data profiling before the first pipeline run, not after the first error reaches a board pack. Inconsistent date formats, duplicate customer IDs, and missing entity codes cause more rework than any other issue. A 2024 literature review by Poon and colleagues, published in Frontiers of Computer Science and covered by phys.org, found that around 94% of business spreadsheets used in decision-making contain errors. Many of those errors travel into consolidated outputs unnoticed.
- Treating consolidation as a one-off project: Source systems change. The business adds a new tracking category in Xero. A new entity joins the group. A subsidiary changes functional currency. Without a maintenance owner, the consolidation drifts and the close gets slower again over time.
- Over-eliminating intercompany balances: Eliminating the entire revenue or expense balance instead of only the intercompany portion is a fast way to break the trial balance reconciliation. Always tie back to source on every run.

Excel Consolidation Versus Automated Workflows
Excel is still the daily tool for most finance teams, and that is fine. The issue is what happens when Excel becomes the consolidation engine instead of the consumption layer.
The Excel Consolidate feature lives under Data > Consolidate, and combines values from multiple ranges using SUM, AVERAGE, COUNT, or other aggregation functions. The standard workflow per Microsoft Support documentation runs as follows:
- Open a fresh worksheet and select the top-left cell where the consolidated output should begin.
- Click Data > Consolidate to open the dialog box.
- Choose the function (SUM, AVERAGE, COUNT, MAX, MIN, or others) that matches your aggregation need.
- Add each source range using the Reference box, clicking Add after each one.
- Tick "Top row" and "Left column" if labels are consistent across source ranges, so Excel consolidates by category rather than position.
- Optionally tick "Create links to source data" if you want the output to update when source values change.
- Click OK to generate the consolidated output.
It works for small departmental rollups. It struggles at three points as group complexity grows:
- Source ranges change shape: When a new column is added to a sub-entity workbook, the link breaks silently and the consolidated output understates without warning.
- Multiple users edit shared workbooks: Formulas drift, version control collapses, and you cannot tell which copy is the source of truth.
- Group structures grow: Manual refresh time scales linearly with each new entity while close deadlines stay fixed, so the close gets slower every quarter.
Automation closes those gaps without forcing teams off Excel. About 75% of dataSights customers continue to work in Excel after onboarding, using the Xero connector for Excel, Power BI, and Google Sheets. The automation sits underneath: data refreshes on a configurable schedule into a dedicated Azure SQL database, intercompany eliminations apply automatically, and the consolidated output appears in the same workbook the team already uses. The familiar interface stays, the manual export step disappears.
How to Choose the Right Approach for Your Business
The right approach is usually clearer than it feels, once you frame three questions:
- How many entities or sources are you consolidating? At small scale, native Excel Consolidate plus tight version control is enough. As the entity count grows, manual rollups start losing money in time and rework, which is the point at which most teams we work with move to automated consolidation.
- How often do you need fresh figures? Quarterly board packs tolerate batch ETL. Weekly management reporting needs scheduled refresh. Daily flash reporting needs near real-time pipelines.
- Is the output for internal management, statutory filing, or both? Statutory output raises the bar on audit trail, intercompany elimination, and FX translation, which is where purpose-built consolidation tooling pays back fastest.
Three patterns map cleanly to those answers:
- Multi-entity Xero group producing both management and statutory accounts: Automated consolidation is usually the better fit, particularly once intercompany trading, FX translation, or audit trail requirements come into play.
- Single-entity service business pulling marketing and finance data into a dashboard: An ELT pipeline into a warehouse with a BI tool on top is usually the better fit.
- Startup with two Xero entities: Native Excel can hold the line until growth tips the balance.
Frequently asked questions
Consolidation merges data from multiple sources into one repository. Reconciliation checks that two records of the same thing agree, like matching a bank statement to a general ledger. You typically reconcile within an entity and consolidate across entities. We cover this distinction in more detail in our explainer on whether reconciliation and consolidation are the same.
It depends on the number of sources, data quality at the start, and whether you are consolidating financial or operational data. In the Xero groups dataSights onboards, a clean two-entity consolidation can go live within days, while a multi-source operational consolidation spanning CRM, ERP, and inventory more often runs to weeks. Actual timelines vary with source-system access, intercompany complexity, and how much data cleanup the team takes on before the first pipeline run, and skipping the data profiling stage tends to be what pushes timelines out.
Yes. Even with two or three sources, the time saved each month from not chasing data is meaningful. The trick is matching the tooling to the scale, since over-engineered platforms cost more to maintain than they save.
ETL, ELT, data warehousing, data lakes, and data virtualisation are the five most common. ETL and ELT describe how data moves. Warehouses and lakes describe where it lands. Virtualisation describes a query layer that avoids moving data altogether.
Use ETL when data quality must be strict before it lands, when datasets are smaller, and when downstream uses are fixed. Use ELT when you have a modern cloud warehouse with elastic compute, when volumes are large, and when downstream use cases keep evolving.
Every dataSights customer gets a dedicated Azure SQL database, which means your consolidated data sits in its own isolated environment rather than a shared multi-tenant store. Built into that model are the security defaults of the Azure SQL platform, including encryption at rest and in transit, plus access controls scoped to each customer’s database alone. For governance and assurance scaffolding, UK teams can use the NCSC cloud security guidance Australian teams the ACSC Essential Eight ACSC Essential Eight NZ Information Security Manual.
Compliance itself depends on accounting judgement and review, not on software. What automated consolidation does is support the operational steps that statutory reporting needs: intercompany eliminations applied consistently each close, FX translation worked through on schedule, and an audit trail your reviewers can follow. For UK, Australian, and New Zealand groups that means working within IFRS 10, with ASC 810 the equivalent reference for US-reporting groups. Read more on how to consolidate financial statementsfor a step-by-step view.
Three patterns dataSights sees most often are skipping the data profiling stage, treating the project as one-off, and over-eliminating intercompany balances. All three are preventable with a documented process, a clear maintenance owner, and validation rules that tie consolidated output back to source.
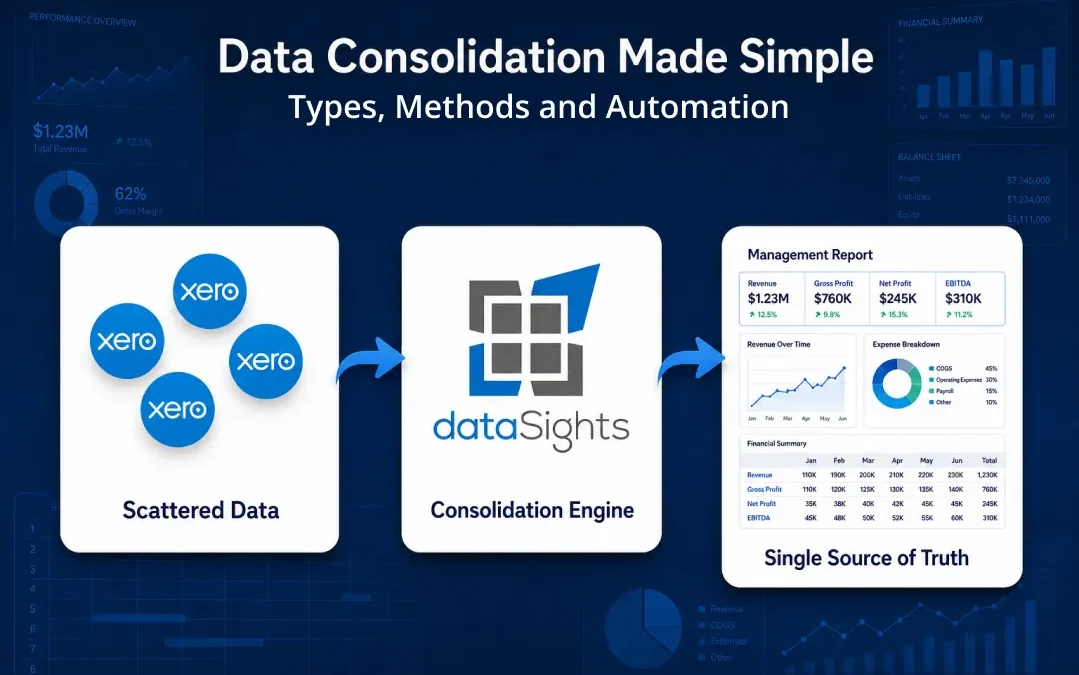
Turning Scattered Data Into a Single Source of Truth
Data consolidation is no longer a nice-to-have. It is the difference between a finance team that closes in five days and one that closes in fifteen. The right approach depends on your scale, refresh cadence, and reporting standard, but the direction of travel is the same: move from manual rollups to automated pipelines that feed your existing tools. If you are running multi-entity finance on Xero, the Xero consolidation pillar guide walks you through what good looks like.
Automate Xero Consolidation With dataSights
Cut the manual exports, the broken formulas, and the version-control headaches. dataSights connects your Xero entities, applies intercompany eliminations on a scheduled refresh, and delivers consolidated output back into Excel, Power BI, or our web Management Reports. Rated 5.0 out of 5 by 90+ verified Xero users, and trusted by 300+ businesses to automate their financial reporting.
Start Your Free 14-Day Trial
Kevin Wiegand
Founder & Client happiness
I'm Kevin Wiegand, and with over 25 years of experience in software development and financial data automation, I've honed my skills and knowledge in building enterprise-grade solutions for complex consolidation and reporting challenges. My journey includes developing custom solutions for data teams at Gazprom Marketing & Trading and E.ON, before founding dataSights in 2016. Today, dataSights helps over 250 businesses achieve 100% report automation. I'm passionate about sharing my expertise to help CFOs and Financial Controllers reduce their month-end close time and eliminate the manual Excel exports that drain their teams' valuable time.