When a group owns multiple subsidiaries, a consolidated financial statements example illustrates exactly how to combine all the information into a single, accurate view. The heavy lifting involves eliminations, non-controlling interests, and reconciling the numbers without last-minute firefighting. If you still close in 15+ days, you’re not alone – but top quartile finance teams consistently finish in about 5 days. This guide provides the precise steps, entries, and checks that CFOs use, along with sources that can be referenced during an audit. Let’s make consolidation repeatable, reviewable, and fast.
What Are Consolidated Financial Statements?
A consolidated financial statements example shows how a parent and its subsidiaries report as one economic entity, eliminating all intragroup balances and transactions and presenting NCI separately in equity (IFRS 10). Intercompany income, expenses, assets, liabilities and cash flows are eliminated in full, and where FX applies, assets and liabilities are translated at the closing rate while income and expenses use transaction-date rates (often approximated by averages).
Ready to Automate Your Financial Consolidation?
Stop wrestling with manual consolidations and broken formulas. dataSights automates multi-entity reporting, Xero consolidations, and Power BI connections. Join 300+ businesses already transforming their financial reporting with our platform, rated 5.0 out of 5 by 77+ verified Xero users.
Table of Contents
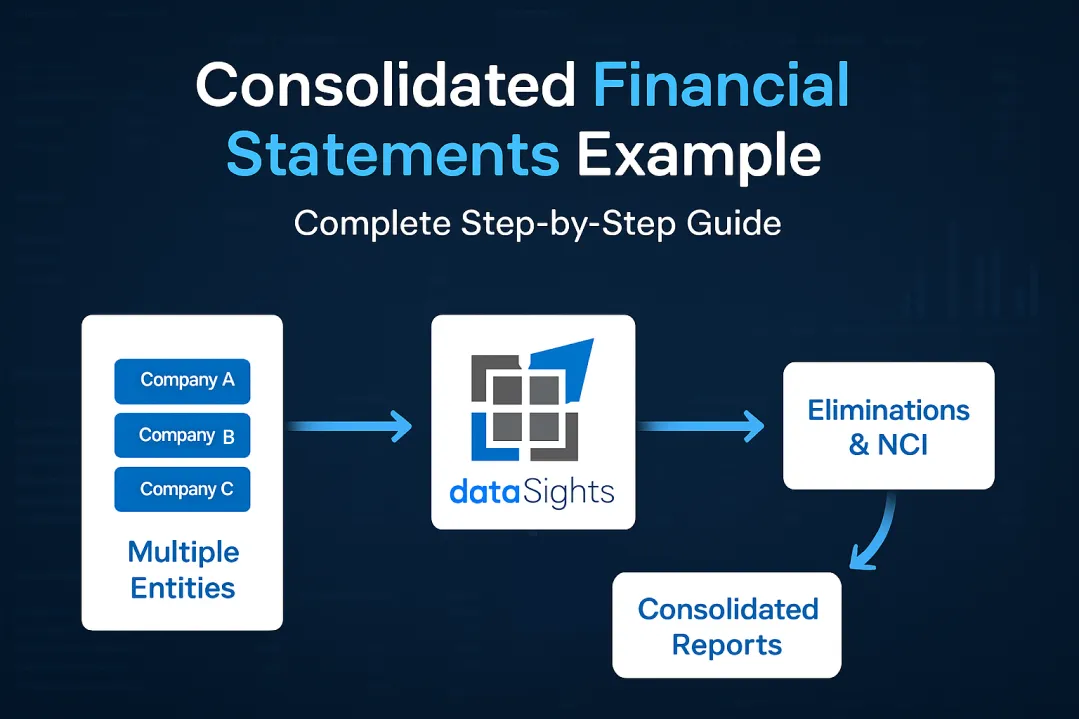
Understanding the Core Components
This section outlines the moving parts of consolidation, allowing you to see how each piece flows into the final group view before we dive into the detailed statements.
Required Financial Statements (IFRS)
Every consolidated financial statements example includes three primary documents that work together to show the complete financial picture:
- Statement of financial position (balance sheet): The consolidated balance sheet combines all assets and liabilities from the parent and subsidiaries, eliminating any intercompany balances. For instance, if Parent Company owns 80% of Subsidiary A, the consolidated balance sheet includes 100% of Subsidiary A’s assets and liabilities, with the 20% not owned shown as non-controlling interest in the equity section.
- Statement of profit or loss and other comprehensive income (income statement/OCI): This statement aggregates revenues and expenses across all entities while removing intercompany sales. If a parent sells $100,000 of products to its subsidiary, this internal sale must be eliminated in full to avoid inflating group revenues.
- Statement of changes in equity: The statement of changes in equity (SoCE) reconciles each component of equity from opening to closing balances and attributes movements between owners of the parent and non-controlling interests (NCI) for a consolidated group.
- Statement of cash flows: The cash flow statement shows the actual movement of cash across the entire group, excluding transfers between group entities. Only external cash transactions appear in the final consolidated view.
- Notes: Include significant accounting policies.
Key Consolidation Elements
Intercompany Eliminations: These adjustments eliminate transactions between group entities to prevent double-counting. Common eliminations include:
- Intercompany sales and purchases
- Intercompany loans and interest
- Intercompany dividends
- Unrealised profits on inventory transfers
Non-Controlling Interest (NCI): When a parent owns less than 100% of a subsidiary, the portion not owned represents the non-controlling interest. IFRS 10 mandates that NCI must be presented separately within equity on the consolidated balance sheet.
To see consolidated statements in action, this video demonstrates how multiple Xero entities combine into unified Power BI reports, showing real examples of the consolidation process we’re discussing.
Step-by-Step Consolidation Process
Let’s work through a practical example to demonstrate the consolidation process with real numbers.
Step 1: Identify Subsidiaries and Ownership
First, determine which entities require consolidation. Consider this example structure:
- Parent Company owns 80% of Subsidiary A
- Parent Company owns 60% of Subsidiary B
- Both subsidiaries require full consolidation because the parent controls them.
Under IFRS 10, control – not a percentage threshold – drives consolidation. Ownership greater than 50% is a common indicator, but the test is power, returns and the ability to affect those returns.
Step 2: Gather Individual Financial Statements
Collect the separate financial statements from each entity. Here’s a simplified example:
Parent Company Balance Sheet:
- Assets: $1,000,000
- Investment in Subsidiary A: $400,000
- Investment in Subsidiary B: $300,000
- Total Assets: $1,700,000
- Liabilities: $500,000
- Equity: $1,200,000
Subsidiary A Balance Sheet:
- Assets: $600,000
- Liabilities: $200,000
- Equity: $400,000
Subsidiary B Balance Sheet:
- Assets: $800,000
- Liabilities: $300,000
- Equity: $500,000
The Trial Balance is the non-negotiable foundation for consolidation. All adjustments must reconcile back to TB. dataSights pulls full Trial Balance data from each entity so consolidated results always tie back to source.
Step 3: Eliminate the Subsidiary’s Equity, Measure NCI, and Recognise Goodwill (Acquisition Date)
At acquisition, bring the subsidiary’s identifiable net assets to fair value, eliminate 100% of the subsidiary’s pre-acquisition equity, and recognise non-controlling interests (NCI) and goodwill (or a bargain purchase gain) as required.
3.1 Restate identifiable net assets to fair value (IFRS 3)
Adjust the subsidiary’s assets and liabilities to their acquisition-date fair values before you compute NCI and goodwill. Typical adjustments include:
- Dr Property, plant and equipment (FV uplift)
- Dr Identifiable intangibles (e.g., customer relationships, brands)
- Cr Deferred tax liability (for taxable temporary differences on FV uplifts; IAS 12)
- Cr/Dr Provisions/Contingent liabilities (if recognised at FV)
This gives you the fair value of identifiable net assets (100%) at the acquisition date.
3.2 Eliminate 100% of the subsidiary’s pre-acquisition equity
Remove the subsidiary’s equity balances in full (not just the parent’s share):
- Dr Share capital – Sub
- Dr Share premium – Sub (if any)
- Dr Pre-acquisition retained earnings – Sub
- Cr Investment in Subsidiary
- Cr Non-controlling interests (NCI)
3.3 Recognise goodwill (or bargain purchase)
Compute goodwill after Step 3.1 (using FV of net assets) and Step 3.2 (elimination), using the NCI measurement basis your group applies:
- Proportionate share (partial goodwill):
Goodwill = Consideration transferred + NCI (proportionate share of net assets) − FV of identifiable net assets (100%) - Fair value NCI (full goodwill):
Goodwill = Consideration transferred + NCI (fair value) − FV of identifiable net assets (100%)
If the result is negative (after reassessment of measurements), recognise a gain on bargain purchase in profit or loss.
Illustrative entries
Facts (illustrative):
- Subsidiary net assets at book value: $400,000.
- FV uplift to PPE: $50,000; related DTL $15,000 → net FV uplift $35,000.
- FV of identifiable net assets (100%): $435,000.
- Parent acquires 80%; NCI = 20%.
- Consideration transferred: Case A: $320,000; Case B: $400,000.
- NCI measured at proportionate share (20% × $435,000 = $87,000).
First, record FV step-ups (Step 3.1):
- Dr PPE 50,000
- Cr Deferred tax liability 15,000
(Net uplift to identifiable net assets = 35,000.)
Then eliminate equity and recognise NCI and goodwill (Step 3.2–3.3):
- Case A — No premium (Investment = parent’s share of FV net assets = $348,000):
Dr Share capital – Sub 400,000
Cr Investment in Subsidiary 348,000
Cr Non-controlling interests (NCI) 87,000
Dr/Cr balancing: none → No goodwill (because Consideration + NCI − FV net assets = 348,000 + 87,000 − 435,000 = 0). - Case B — Premium paid (Investment = $400,000):
Dr Share capital – Sub 400,000
Dr Goodwill 52,000
Cr Investment in Subsidiary 400,000
Cr Non-controlling interests (NCI) 87,000
(Goodwill = 400,000 + 87,000 − 435,000 = 52,000.)
If NCI is measured at fair value (full goodwill): replace the $87,000 with its fair value and recompute goodwill using the same formula.
Common variations to address
- Pre-acquisition reserves: include pre-acquisition retained earnings (and other equity components) in the equity elimination (Dr).
- Contingent consideration: classify as liability or equity per IFRS 3; measure at FV at acquisition; subsequent changes for liabilities go to P&L (not goodwill).
- Measurement-period adjustments: retrospectively adjust goodwill and comparative amounts when new information about facts at acquisition date emerges (IFRS 3).
- Step acquisitions: remeasure any previously held interest to FV through profit or loss at the acquisition date, then apply Step 3.1–3.3.
Where this leads: Step 4 will attribute post-acquisition profit and OCI between owners of the parent and NCI, and roll those movements through the statement of changes in equity (IAS 1).
Step 4: Attribute Post-acquisition Results to Owners and NCI, and Roll Them Through Equity (Each Period)
After recognising NCI at acquisition (Step 3), attribute each period’s profit or loss, OCI, and dividends between owners of the parent and non-controlling interests (NCI). Present the split on the face of the statements (IAS 1) and update the statement of changes in equity (SoCE).
4.1 Start with post-acquisition results (per subsidiary). Use the subsidiary’s profit after tax and OCI for the current period (post-acquisition only).
4.2 Adjust for group effects before attribution
Update the subsidiary’s results for consolidation-specific effects:
- Intragroup eliminations (unrealised profit on inventory/PPE, intercompany interest, services, royalties).
- Upstream (sub → parent): the elimination affects both owners and NCI pro-rata.
- Downstream (parent → sub): the elimination affects owners of the parent only.
- Depreciation/amortisation on fair-value step-ups recognised at acquisition (IFRS 3).
- Goodwill impairment (IAS 36), if any.
- If NCI measured at proportionate share (partial goodwill): goodwill sits with the parent only → impairment is attributed to owners.
- If NCI measured at fair value (full goodwill): impairment is allocated between owners and NCI.
- Foreign currency translation for foreign operations (IAS 21): translation differences go to OCI (FCTR) and are attributed between owners and NCI.
4.3 Attribute results to owners and NCI
- NCI share of profit = NCI % × (adjusted profit after tax).
- NCI share of OCI = NCI % × (adjusted OCI, by component).
- The remainder is attributable to owners of the parent.
(IFRS 10 requires attribution even if this creates a deficit balance for NCI.)
4.4 Dividends and ownership changes
- Dividends paid by the subsidiary to the parent eliminate within the group (no consolidated P&L impact).
- Dividends paid to NCI reduce NCI in equity (shown in the SoCE, not in P&L).
- Ownership changes without loss of control are recorded directly in equity: adjust NCI and equity attributable to owners; no gain/loss in profit or loss (IFRS 10).
4.5 Express roll-forward (per subsidiary)
NCI (closing) = NCI (at acquisition)
- NCI% × Adjusted profit after tax
- NCI% × Adjusted OCI (by component)
− Dividends paid to NCI
± Effects of ownership changes without loss of control
± FX translation of NCI (if foreign operation)
Illustration (continuing the Step 3 example)
- NCI at acquisition (from Step 3): $87,000 (20% of FV net assets).
- Sub A profit after tax: $60,000.
- Adjustments before attribution: FV step-up depreciation $8,000; unrealised upstream profit $5,000 → Adjusted profit = $47,000.
- OCI (FVOCI reserve) for the period: $10,000.
- Dividends paid by Sub A: $15,000 → to NCI = $3,000.
Attribution and roll-forward
- NCI share of profit = 20% × 47,000 = $9,400
- NCI share of OCI = 20% × 10,000 = $2,000
- NCI closing = 87,000 + 9,400 + 2,000 − 3,000 = $95,400
Presentation
- On the statement of profit or loss and OCI: show “Profit attributable to: owners / NCI” and “Total comprehensive income attributable to: owners / NCI”.
- In the SoCE: include an NCI column with opening balance (including acquisition-date NCI), add NCI’s share of profit and OCI, deduct dividends to NCI, and reflect ownership changes without loss of control.
Practical tip: The attribution is a presentation allocation supported by your consolidation worksheet—no separate “attribution journal” is needed beyond the eliminations and measurement entries you’ve already made.
Eliminations: The Hardest Part of Consolidation
Intercompany eliminations are not just another step in the process – they are the single most challenging part of financial consolidation. Eliminations remove transactions between group companies so the consolidated statements reflect only external activity.
Why eliminations matter:
- Without them, consolidated reports double-count revenues, expenses, assets, or liabilities.
- Manual eliminations in spreadsheets lack audit trails, making it nearly impossible to prove adjustments during an audit.
- Timing differences and mismatches between entities often result in unreconciled balances that are discovered too late in the close process.
Common elimination categories:
- Intercompany sales, purchases, and unrealised profits
- Intercompany loans and interest charges
- Intercompany dividends and management fees
Risks of manual eliminations:
- Formula errors and broken spreadsheet links
- No system-level documentation of who made what adjustment and when
- Delayed discovery of mismatches, often weeks after month-end
How automation helps:
- Predefined elimination rules ensure consistency across periods
- Full audit trails record the user, timestamp, and rationale for every elimination entry
- Continuous consolidation surfaces mismatches daily instead of two weeks after close
- Repeatable, documented processes transform eliminations from risky guesswork into reliable, audit-ready adjustments
Every elimination must reconcile back to the group’s consolidated Trial Balance. This ensures adjustments don’t create imbalances or hide errors. Manual eliminations introduce the highest risk of error in the consolidation process. The automation section below explains how systems like dataSights mitigate these risks through the use of repeatable rules and comprehensive audit trails.
Note for Xero users: Xero provides entity-level reporting only – no native multi-entity consolidation or automatic intercompany eliminations. dataSights fills this gap with live consolidated Trial Balances, auto-eliminations and audit trails across small and large groups.
Prepare Consolidated Statements
After all adjustments, combine the remaining balances:
Consolidated Balance Sheet:
- Total Assets: $2,398,000 (Parent + 100% of subsidiaries – eliminations)
- Total Liabilities: $1,000,000
- Equity attributable to parent: $1,118,000
- Non-controlling interests: $280,000
- Total Equity: $1,398,000

Consolidation Journal Entries Examples
Understanding the journal entries is key to accurate consolidation. Here are the most common examples:
Elimination of Subsidiary Investment
When Parent Company owns 75% of Subsidiary:
Dr. Share Capital – Subsidiary 300,000
Dr. Retained Earnings – Subsidiary 200,000
Dr. Non-Controlling Interest 166,667
Cr. Investment in Subsidiary 666,667
Elimination of Intercompany Sales
When Parent sells to Subsidiary:
Dr. Sales Revenue 100,000
Cr. Cost of Goods Sold 100,000
Elimination of Intercompany Dividends
When Subsidiary pays dividends to Parent:
Dr. Dividend Income 40,000
Cr. Dividends Paid 40,000
Unrealised Profit Elimination
For inventory still held within the group:
Dr. Cost of Goods Sold 15,000
Cr. Inventory 15,000
Working With Different Consolidation Methods
Control drives the method. Here’s how ownership and rights impact accounting, what appears on the face of the statements, and when each approach applies.
Full Consolidation Method
Used when ownership exceeds 50%, this method includes 100% of the subsidiary’s financials. The parent company reports all assets, liabilities, revenues, and expenses of the subsidiary, with non-controlling interests shown separately.
Equity Method
Use the equity method when you have significant influence (typically 20–50% ownership). This method doesn’t fully consolidate the subsidiary. Instead, the investment appears as a single line item on the balance sheet, valued at cost plus the parent’s share of post-acquisition profits.
Proportionate Consolidation
Proportionate consolidation was permitted under IAS 31 – Interests in Joint Ventures, but this option was removed when IFRS 11 – Joint Arrangements took effect in 2013. According to the IFRS 11 FAQs, joint ventures must now be accounted for using the equity method, with only joint operations recognising a share of assets and liabilities.
Common Consolidation Challenges and Solutions
Even mature teams hit the same friction points. Treat this as a pre-close checklist to identify and address intercompany, foreign exchange, and policy gaps early and fix them systematically.
Challenge 1: Reconciling Intercompany Balances
Intercompany accounts often don’t match due to timing differences or errors. The solution involves systematic reconciliation before consolidation begins. Create a standard reconciliation template that both entities complete monthly, identifying and resolving differences before the consolidation process starts.
Challenge 2: Multiple Reporting Currencies
When subsidiaries operate in different countries, currency translation adds complexity. IAS 21 requires the use of the closing rate for balance sheet items and average rate for income statement items (when exchange rates don’t fluctuate significantly).
Challenge 3: Different Accounting Policies
Subsidiaries may use different depreciation methods or inventory valuation approaches. Before consolidation, adjust the subsidiary financials to align with the group’s accounting policies, documenting all adjustments for audit purposes.
Challenge 4: Manual Elimination Errors
Spreadsheet-based consolidation often leads to formula errors and broken links. The manual process typically requires 15+ days for month-end close, with a significant risk of errors in elimination entries.
Jurisdictional Exemptions for Consolidated Accounts
Not every group is legally required to prepare consolidated financial statements. Regulations vary by country, and exemptions exist for smaller groups:
- United Kingdom: Under the Companies Act 2006, small groups may be exempt from preparing consolidated accounts if they meet size thresholds.
- Australia and New Zealand: Subsidiaries may be exempt if their results are already consolidated into higher-level group accounts.
Practical Note: Even when statutory consolidation is not required, many Xero-using groups still prepare management consolidations for boards, investors, and lenders. These provide a true picture of group performance and are essential for decision-making.

Automating Your Consolidation Process
Manual consolidation in Excel involves copying data from multiple sources, creating elimination entries, and constantly checking that everything balances. Based on client feedback, automated consolidation can reduce month-end close from over 15 days to under 5 days.
Benefits of Automation
- Time Savings: Automated systems eliminate the need for manual data entry and formula creation, resulting in significant time savings. What typically takes weeks can be completed in days, freeing your finance team for analysis rather than data manipulation.
- Accuracy Improvements: Automated eliminations ensure consistency and reduce errors. Every intercompany transaction is tracked and eliminated according to predefined rules, with full audit trails.
- Real-Time Visibility: Instead of waiting until month-end to see consolidated results, automated systems provide continuous consolidation. Issues surface immediately rather than during the closing process.
- Audit Trail Documentation: Every elimination entry is documented with timestamps and user identification. This creates the audit trail required for compliance without additional manual documentation.
The Role of Power BI in Modern Consolidation
Power BI transforms static consolidated reports into interactive dashboards. Finance teams can drill down from consolidated totals to individual entity details, analyse variances, and track KPIs in real-time. When connected to automated data sources, Power BI dashboards update automatically as new data flows in.
The combination of automated consolidation and Power BI reporting gives CFOs immediate visibility into group performance. Instead of waiting weeks for consolidated reports, leadership can access current financial positions on a daily basis.
Real-World Consolidation Example
Let’s examine a practical scenario to illustrate the complete process:
Scenario: ABC Holdings owns 75% of XYZ Manufacturing and 90% of DEF Services. During the year:
- XYZ sold $500,000 of products to DEF
- DEF still holds $100,000 of this inventory at year-end
- ABC provided a $1 million loan to XYZ at 5% interest
- All entities use different ERP systems
Consolidation Steps Applied:
- Data Collection: Export Trial Balances from each ERP system
- Currency Alignment: Convert XYZ’s EUR balances to USD at closing rate
- Policy Adjustments: Align XYZ’s LIFO inventory to ABC’s FIFO method
- Elimination Entries:
- Remove $500,000 intercompany sale
- Eliminate $20,000 unrealised profit (20% margin on $100,000 inventory)
- Remove $1 million intercompany loan and $50,000 interest
- Eliminate ABC’s investments against subsidiary equity
- NCI Calculation:
- XYZ: 25% of net assets = $250,000
- DEF: 10% of net assets = $80,000
- Final Consolidation: Combine adjusted balances with eliminations
The result: consolidated statements that accurately represent the group as a single economic entity, with all internal transactions removed and minority interests properly presented.
Frequently Asked Questions
What Is the Difference Between Consolidated and Combined Financial Statements?
Consolidated financial statements treat the parent and its subsidiaries as a single entity, eliminating all intercompany transactions. Combined financial statements (often used under common control without a parent) are not defined in IFRS and are jurisdiction-specific. Many combined presentations still eliminate intra-group transactions and balances to avoid overstatement – policies should be disclosed. Consolidation is required when control exists; combination is used when entities are under common control but lack parent-subsidiary relationships.
How Do You Calculate Goodwill in Consolidation?
Goodwill equals the purchase price minus the fair value of net assets acquired. For example, if you pay $1 million for 80% of a company with $900,000 fair value net assets, goodwill = $1,000,000 – (80% × $900,000) = $280,000. This appears as an intangible asset on the consolidated balance sheet.
When Should You Use the Equity Method Instead of Full Consolidation?
Use the equity method when you have significant influence (IAS 28) – often presumed at 20% or more, but determined by facts and circumstances. Full consolidation applies when you control the investee (IFRS 10). Interests with joint control fall under IFRS 11 and are typically equity-accounted.
What Are Elimination Entries in Consolidation?
Elimination entries remove transactions between group companies to avoid double-counting. Common eliminations include intercompany sales, loans, dividends, and management fees. These ensure consolidated statements reflect only external transactions.
How Do You Handle Different Year-Ends in Consolidation?
IFRS 10.B93 allows up to three months difference between parent and subsidiary year-ends. Adjust for significant transactions during the gap period. Many groups require subsidiaries to prepare special-purpose financials aligned with the parent’s year-end.
What Is Non-Controlling Interest and Where Does It Appear?
Non-controlling interest represents the portion of a subsidiary not owned by the parent. It appears in the equity section of the consolidated balance sheet, separate from parent shareholders’ equity. In the income statement, NCI’s share of profit appears after net income.
Can You Consolidate if You Own Less Than 50%?
Yes, if you have de facto control through other means, such as board representation, contractual arrangements, or potential voting rights. IFRS 10 focuses on control rather than just ownership percentage.
How Do You Eliminate Unrealised Profits in Inventory?
Calculate the profit margin on intercompany sales where goods remain in the buying entity’s inventory. Debit cost of sales and credit inventory for this amount. This ensures inventory is valued at cost to the group, not the marked-up intercompany price.
What Accounting Standards Govern Consolidation?
IFRS 10 governs consolidation under International Financial Reporting Standards. In the US, ASC 810 provides consolidation guidance under US GAAP. Both focus on control as the basis for consolidation, but have some detailed differences.
How Long Should Consolidation Take?
Manual consolidation typically takes 15+ days for month-end close. With automation, this reduces to under 5 days. The complexity depends on the number of entities, intercompany transactions, and reporting requirements.
Is Proportionate Consolidation Still Allowed Today?
No. Since IFRS 11 (2013), proportionate consolidation is no longer permitted for joint ventures. The equity method is now mandatory under IFRS.
Master Your Financial Consolidation Journey
Consolidated financial statements don’t have to consume weeks of manual work and countless reconciliations. While the examples and steps outlined here provide the foundation for accurate consolidation, modern finance teams are discovering that automation transforms this complex process from a month-end marathon into a streamlined, accurate workflow. Ready to see how real-time consolidation actually works in practice?
Transform Your Consolidation Process with Automated Xero to Power BI Integration
Stop spending weeks on manual consolidations and Excel eliminations. dataSights connects your Xero entities directly to Power BI, automating the entire consolidation process – from Trial Balance to final reports. With 77+ five-star reviews from finance teams who’ve already cut their month-end close from over 15 days to under 5, you’ll get real-time consolidated dashboards that actually balance. See how automated consolidation transforms your financial reporting.
About the Author
Kevin Wiegand
Founder & Client happiness
I’m Kevin Wiegand, and with over 25 years of experience in software development and financial data automation, I’ve honed my skills and knowledge in building enterprise-grade solutions for complex consolidation and reporting challenges. My journey includes developing custom solutions for data teams at Gazprom Marketing & Trading and E.ON, before founding dataSights in 2016. Today, dataSights helps over 250 businesses achieve 100% report automation. I’m passionate about sharing my expertise to help CFOs and Financial Controllers reduce their month-end close time and eliminate the manual Excel exports that drain their teams’ valuable time.