Important note; only Xero data was used in the making of this story
Understanding, measuring and optimising metrics within a business, enables empowered decision making, which is critical for business success and sustainable growth. The customer acquisition cost (CAC) metric is an essential metric for businesses that can now be easily monitored on a timely basis using real time data. This article explores what the CAC metric measures, what the benefits are, what need to be considered when looking at the CAC metric, and what an ideal CAC metric is.
However before we continue, I’d like to bring to your attention a few of the metrics that we will be paying attention to in order to answer the marketing spend question posed.
- CAC
- Average revenue per customer
- Number of clients
- Number of new clients
- Revenue growth over a wide period
What does the customer acquisition cost (CAC) metric measure?
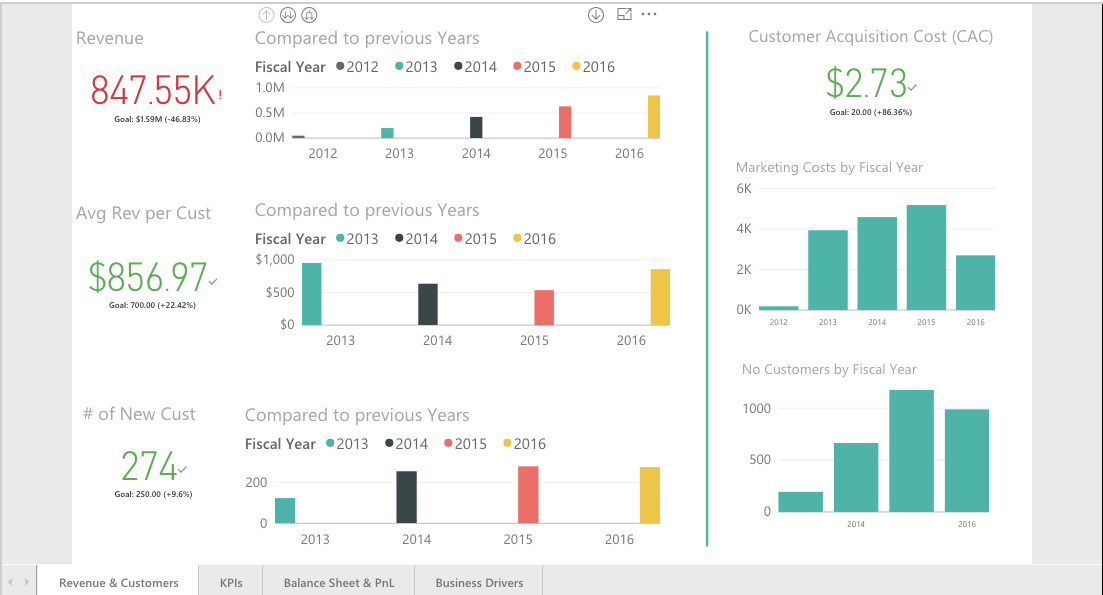
The customer acquisition cost (CAC) metric is the cost of convincing a new customer to spend money with a business. It measures the expenses related to marketing activities that entice a customer to open their wallet and purchase a business’s goods or services, divided by the number of new customers, over a period.
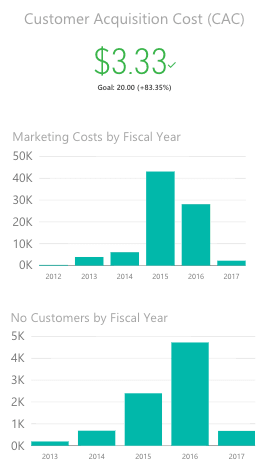
Marketing costs from Chart of Accounts in Xero, divided by no. of new customers over each fiscal year.
How do you get the no. of new clients you ask? Simple, the number of Invoices Receivable where the contact on the invoice has not appeared on a previous invoice. Simple if you have the full Xero history that is 😉
What are the benefits of monitoring customer acquisition cost (CAC)?
Analysis of the CAC metric assists in recognising what marketing spend results in new customers and refining marketing activities to ensure an optimal outcome. A successful business focuses on marketing activities that convert potential customers to paying customers and cuts ineffective marketing spend.
What to consider when looking at the customer acquisition cost (CAC)?
The CAC metric is reviewed alongside other business metrics, as they are interdependent. While reducing marketing spend may improve the CAC in the short term, it may also impact the quality of customers the business attracts and the longevity of the business model. For the metric to be useful, ideally the period measured should capture the lead time, between marketing spend, and new customer spend. So, the metric is analysing the marketing spend that directly influenced the new customer. The stage in the business’s life cycle also needs to be recognised. A start-up business initially has a high CAC. It needs to focus on reducing its CAC, while established in the market place. The start-up needs funds in place to support it until it stabilises as an established business.
What is an ideal customer acquisition cost (CAC)?
The CAC metric compared to the average revenue per customer gives an indication of how viable the business model is in the short term. Macro and micro economic factors like industry trends, technology and location may impact the businesses CAC.
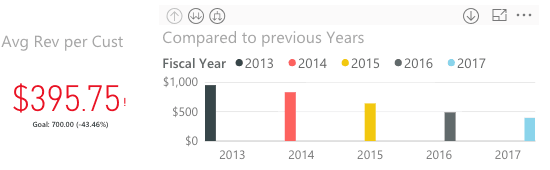
Average revenue per customer. The KPI is the current financial year and the graph is the year on year comparison.
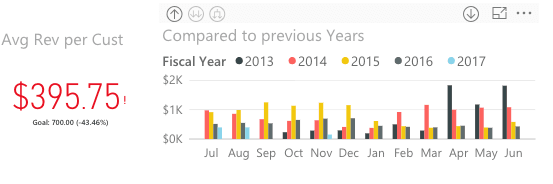
Average revenue per customer. The KPI is the current financial year and the graph is the year on year comparison.
If the CAC is $100 and the average revenue per customer is $100 than the average return of the business is 1:1. The average return indicates a business destined for failure. Either marketing expenses need reducing, or the customer needs to be encouraged to spend more money with the business. If it is in the early stages of business, the CAC needs to monitor for improvement, and the business needs to have funds in place to cover them during growth.
If the CAC is $100 and the average revenue per customer is $300 than the average return of the business is 1:3. The average return indicates a feasible business model and the CAC metric should be monitored to ensure it remains stable or improves.
If the CAC is $100 and the average revenue per customer is $1000 than the average return of the business is 1:10. The average return indicates a strong business model, which may warrant further analysis and exploitation of the profitable returns.
If the CAC is $100 and the average venue per customer is $9000 than the average return of the business is 1:90. An initial reaction would be that the data used in the calculation is not complete, and has not captured the reality of the situation correctly. Perhaps it is a cash business that does not issue individual invoices, and customer numbers have not been properly counted and reflected in the data?
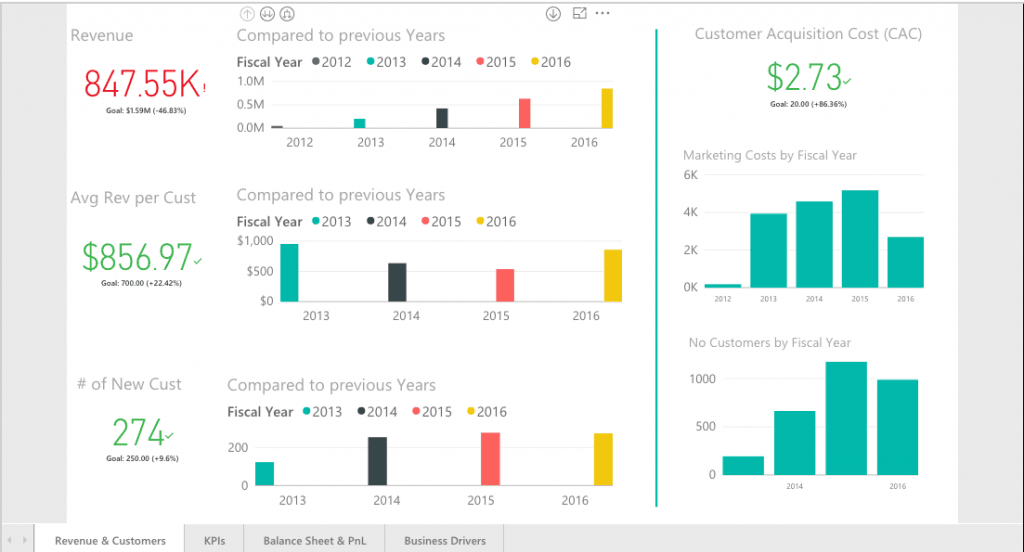
Revenue growth and Marketing report. These are benchmarked figures combining multiple Xero files. Using the DataSights platform it is very easy to view this report over 1 Xero file or several.
In summary, whether you are an accountant who wants to add a service which helps with insights such as the above or you are a business that wants to make sure your AdWords spend doesn’t overtake your customer spend, we can help surface and monitor these metrics for you with relative ease!
Get in touch with us at www.datasights.co for either an explanation or a demo or just a chat!