Global financial consolidation gets messy fast when your group spans currencies, time zones, and reporting rules. One close, you’re translating USD, AUD, and SGD into GBP; the next, you’re reconciling intercompany balances that won’t eliminate cleanly because FX has moved. If you’re still doing it in Excel, every extra entity adds more rate tables, more mappings, and more places for a formula to break. This article shows how multinational groups translate, eliminate, and align policies so the close stays auditable and predictable. Let’s start with a quick definition, then work through the technical steps and common pitfalls.
Global Financial Consolidation
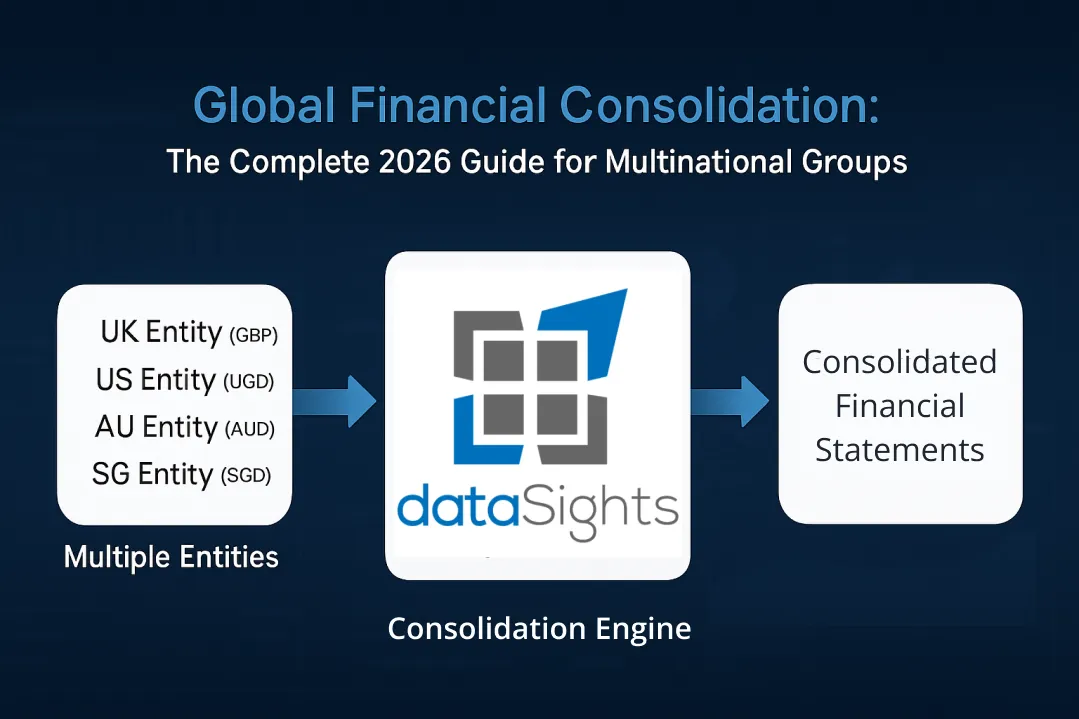
Global financial consolidation combines entity trial balances into a single set of group financial statements, translating functional currencies in accordance with IAS 21 (assets and liabilities at closing rates; income and expenses at average rates, where appropriate; equity components largely at historical rates, with translation differences recognised in other comprehensive income) and eliminating intercompany balances and transactions. It also includes policy alignment where subsidiaries report under different frameworks, so the group presents under the parent’s standard (for example, UK-adopted IFRS or US GAAP). As entity count and currency exposure grow, automating those rules reduces spreadsheet risk and shortens the close.
Ready to Automate Your Financial Consolidation?
Stop wrestling with manual consolidations and broken formulas. dataSights automates multi-entity reporting, Xero consolidations, and Power BI connections. Join 300+ businesses already transforming their financial reporting with our platform, rated 5.0 out of 5 by 77+ verified Xero users.
Table of Contents
Why Global Financial Consolidation Differs from Domestic Consolidation
Multinational consolidation introduces complexity that domestic groups avoid entirely.
Currency Translation Requirements
Each foreign subsidiary measures transactions in its functional currency under IAS 21 – the currency of its primary economic environment.
- Your Singapore entity records revenue in SGD.
- Your US subsidiary reports expenses in USD.
- On consolidation, these translate to your presentation currency (say, GBP).
- Assets and liabilities translate at closing rates. Income and expenses translate at average rates.
- Equity items remain at historical rates.
- The cumulative translation adjustment accumulates in Other Comprehensive Income until you dispose of the foreign operation.
Manual currency conversion across 20 entities can mean applying 40+ exchange rates each month (closing and average rates for each entity). One incorrect rate applied to a $10m balance can create a £200k swing at current exchange rates. At that scale, groups typically move translation rates and rules into a controlled process so results don’t depend on manual updates.
Multiple Accounting Standards
Your UK parent applies UK-adopted IFRS. Your US subsidiary follows US GAAP. Your Australian entity complies with Australian Accounting Standards (based on IFRS with local modifications). Before consolidation, you align accounting policies to the group standard under IFRS 10. This might mean adjusting your US subsidiary’s goodwill amortisation (if your US subsidiary applies the US GAAP private-company alternative) to IFRS treatment (impairment-only under IAS 36). Or recalculating your Australian entity’s lease accounting to match group policy.
Policy alignment adjustments sit outside entity ledgers. Your US subsidiary’s statutory accounts may show amortised goodwill, while group reporting reverses that through consolidation journals. As these adjustments roll forward period to period, you need a clear workflow and evidence trail so the rationale, calculation, and approvals remain auditable.
Cross-Border Intercompany Transactions
For example, UK Parent invoices Singapore Sub for £500,000. Singapore records SGD at the invoice-date rate, then the payable retranslates at month-end. On consolidation, eliminating receivables/revenues against payables/expenses can create an FX difference that must be recognised (P&L or OCI, depending on the underlying item).
Timezone Coordination
- Australia (subsidiary): Closes at 5:00 pm AEDT (UTC+11) on the last day of the month → 6:00 am GMT/UTC same day
- UK (parent): Closes at 5:00 pm GMT (UTC+0) → 3:00 am AEST next day (or 4:00 am AEDT during Australian daylight saving months)
- US West Coast (entity): Closes at 5:00 pm PST (UTC−8) → 1:00 am GMT/UTC next day → 11:00 am AEST (or 12:00 pm AEDT during Australian daylight saving months) next day
Implication: Coordinating a simultaneous group close, therefore, requires either accepting a 24-hour delay (Australia waits a full day for US data) or implementing rolling close processes where each region submits as soon as the local close is complete.
Manual consolidation often waits for the last entity to submit before analysis can start. With automated refresh, the group model updates as regions submit, so finance can begin review earlier, even when entities close at different local times.
Regulatory Complexity
Each jurisdiction imposes statutory reporting requirements beyond group consolidation. Your UK entities file accounts with Companies House under the Companies Act 2006. Your US subsidiaries comply with SEC requirements if publicly traded. Your Australian entities lodge with ASIC under the Corporations Act 2001. Managing group consolidation means producing one set of consolidated statements meeting your chosen framework (IFRS or GAAP) plus separate statutory accounts for each jurisdiction’s local regulator.
Audit requirements multiply across borders. Your group auditor coordinates with local audit firms in each significant subsidiary jurisdiction. They need consolidation workpapers showing exactly how local GAAP numbers reconcile to group IFRS figures. System-level audit trails become non-negotiable. As adjustments roll forward across periods, you need clear evidence of what changed, who approved it, and how figures reconcile back to entity trial balances.
The Technical Process for Global Consolidation
Multinational consolidation follows the same fundamental steps as domestic consolidation, but with additional complexity at each stage.
Data Gathering Across Time Zones
Each subsidiary produces a Trial Balance in its functional currency aligned to the group chart of accounts. Your Singapore entity exports its Trial Balance in SGD, mapped to group account codes. Your UK subsidiary provides GBP Trial Balance already in presentation currency. Your US subsidiary delivers a USD Trial Balance requiring translation.
Consolidation starts with Trial Balance collection, not summary P&L and Balance Sheet figures. Trial Balance detail lets you trace consolidated line items back to individual transactions in each entity. When consolidated “Professional Fees” shows unexpected variance, you drill to see your Singapore entity booked SGD 50,000 in legal fees related to a local contract dispute.
Automated Trial Balance collection means each entity’s accounting system pushes data to the consolidation layer on your schedule. As entities submit, the latest trial balances are available for review and consolidation without waiting for manual exports.
Currency Translation
Translation follows IAS 21 requirements, applying different rates to different financial statement elements.
- Assets and Liabilities: Closing rate at balance sheet date. On 31 December, if GBP/USD closing rate is 1.27, your US subsidiary’s $10m inventory translates to £7.87m. Your US subsidiary’s $5m payables translate to £3.94m.
- Income and Expenses: Average rate for the period. If average GBP/USD for December was 1.28, your US subsidiary’s $2m revenue translates to £1.56m. Your US subsidiary’s $1.2m expenses translate to £938k.
- Equity: Historical rates at transaction dates. Your US subsidiary’s share capital of $1m issued 5 years ago when GBP/USD was 1.35 translates to £741k – and stays at £741k until you dispose of the subsidiary.
Translation Differences: The mismatch between assets/liabilities at closing rate, income/expenses at average rate, and equity at historical rates creates a translation difference. This flows to Other Comprehensive Income as the cumulative translation adjustment in equity. It stays there until you sell or liquidate the foreign operation. For your US subsidiary, if translation differences accumulate to £200k debit over multiple periods, that £200k sits in equity as “Foreign Currency Translation Reserve” – reducing consolidated equity without touching consolidated profit.
Automating currency translation means configuring exchange rate tables that update daily or monthly, depending on your materiality thresholds and risk appetite. Your consolidation layer stores closing rates and average rates for each currency pair. When exchange rates update, consolidated statements refresh automatically, reducing reliance on manual updates and spreadsheet links.

Accounting Policy Alignment
IFRS 10 requires uniform accounting policies across the group. If your US subsidiary depreciates plant over 10 years while your group policy specifies 15 years, adjust the US subsidiary’s accounts before consolidation.
These adjustments occur at the consolidation layer, not in entity ledgers. Your US subsidiary’s statutory accounts continue showing 10-year depreciation (correct under US GAAP and their local requirements). Your consolidated workpapers include an adjustment journal:
Dr Accumulated Depreciation (elimination entry)
Cr Depreciation Expense (elimination entry)
This brings the US subsidiary’s plant depreciation in line with group policy for consolidation purposes. The adjustment sits in consolidation software or Excel workpapers – not in the US subsidiary’s QuickBooks file.
Common policy alignment adjustments include:
- Depreciation rates and methods
- Inventory valuation (FIFO vs weighted average)
- Revenue recognition timing
- Provisioning policies for bad debts and warranties
- Lease classification and measurement
- Foreign exchange gains/losses treatment
Across multiple entities and periods, policy adjustments become difficult to control without consistent documentation and approvals. A governed consolidation layer keeps the calculation, rationale, and sign-off attached to each journal so audits don’t depend on reconstructing workpapers after the fact.
Intercompany Eliminations
Eliminate all transactions and balances between group entities. Your UK parent loans £1m to your Singapore subsidiary. Both the £1m loan receivable (UK books) and the £1m loan payable (Singapore books, translated from SGD) eliminate on consolidation. The group hasn’t lent itself money – it’s all within the same economic entity.
- Intercompany Revenue and Expenses: Your UK parent charges £200k management fees to your Australian subsidiary. UK records £200k revenue. Australia records AUD 380k expense (at transaction date rate). By month-end, that AUD 380k retranslates to £210k at closing rate. You eliminate £200k intercompany revenue and £210k intercompany expense. The £10k difference is FX impact and flows through consolidated P&L.
- Intercompany Loans and Interest: Your Singapore subsidiary owes your UK parent £500k. Eliminate the full receivable and payable at closing rate translation. If Singapore pays 5% interest annually (£25k), eliminate both the £25k interest income (UK) and £25k interest expense (Singapore, translated). Interest rates agreed between group entities should align with arm’s length pricing under OECD transfer pricing guidelines to avoid tax authority challenges.
- Unrealised Profit on Inventory: Your US subsidiary sells inventory to your UK parent at $200k cost plus 25% markup = $250k sale price. UK parent hasn’t resold the inventory externally by year-end. That $50k markup is unrealised profit to the group – UK holds inventory the group manufactured for $200k but values at $250k on its books. Eliminate the $50k unrealised profit from consolidated inventory and consolidated gross profit. The elimination reverses when UK parent sells externally.
Intercompany eliminations require detailed transaction-level data. You can’t eliminate “some of the revenue” without knowing exactly which invoices represent intercompany sales. Consolidation databases that connect to entity accounting systems pull transaction details automatically. When your UK parent posts an invoice to your Singapore entity, that invoice tags as intercompany in near real-time. Month-end eliminations process automatically from tagged transactions rather than requiring finance teams to manually identify each intercompany line.
Non-Controlling Interest Allocation
If you own 80% of your Singapore subsidiary, consolidated financial statements include 100% of Singapore’s assets, liabilities, revenue, and expenses. The 20% owned by external shareholders appears as Non-Controlling Interest (NCI) in consolidated equity and profit allocation.
On the Balance Sheet: NCI appears as a separate line in consolidated equity, distinct from parent shareholders’ equity. If your Singapore subsidiary has net assets of £5m after consolidation eliminations, £1m (20%) is NCI.
On the Income Statement: Singapore’s profit after eliminations was £800k for the period. The consolidated income statement shows £800k profit, but £160k (20%) is attributed to NCI. The statement shows:
- Profit for the period: £800k
- Attributable to parent shareholders: £640k
- Attributable to non-controlling interests: £160k
NCI calculations apply after all intercompany eliminations. If eliminations reduce Singapore’s profit from £1m to £800k, NCI receives 20% of £800k – not 20% of £1m.
Consolidation Adjustments and Journals
Beyond intercompany eliminations, consolidation requires adjustment journals for items that don’t appear in entity ledgers but affect group accounts.
- Goodwill Recognition: When your group acquired your US subsidiary for $15m and the subsidiary had net assets of $10m, you recognised $5m goodwill on acquisition. That goodwill lives only in consolidated accounts – not in the US subsidiary’s QuickBooks. Consolidation journals add the $5m goodwill asset and test it annually for impairment under IAS 36.
- Equity Pickup from Joint Ventures: If you have a 50% joint venture in India, you don’t consolidate it under IFRS 11 – you equity account under IAS 28. Each period, record your 50% share of the joint venture’s profit as a one-line adjustment in consolidated accounts. The joint venture earned ₹10m profit (£95k at average rate). Your consolidation journal records £47.5k as “Share of Profit from Joint Venture.”
- Fair Value Adjustments: When you acquired your Australian subsidiary, you revalued its plant and equipment from AUD 2m book value to AUD 3m fair value. That AUD 1m fair value uplift exists only for consolidation – the Australian entity’s books continue showing historical cost. Consolidation adjustments add AUD 1m to plant asset value and increase depreciation accordingly.
These adjustments accumulate over time. Your three-year-old acquisition requires tracking:
- Fair value adjustments
- Goodwill
- Amortisation of intangibles recognised on acquisition
By year three, you may be managing dozens of roll-forward consolidation journals unrelated to current-period transactions. Storing these journals in a governed consolidation layer helps you carry balances forward consistently and avoid rework each close.
Automated consolidation databases store adjustment journals as configured rules that apply each period automatically. Your goodwill impairment test runs quarterly. Your fair value depreciation calculates from stored acquisition-date values. Your joint venture equity pickup pulls from connected subsidiary data feeds.
Common Challenges in Global Financial Consolidation
Even with a clear process, global groups tend to hit the same friction points: volatile FX rates, inconsistent charts of accounts across systems, intercompany mismatches that span currencies, and limited audit trail when adjustments live in spreadsheets. The sections below cover the most common failure points and what to control first.
1. Multi-Currency Volatility
Exchange rates fluctuate daily. Your month-end closing rate might differ by 2-3% from average rate. A 2% swing on £10m of translated assets creates £200k consolidated balance sheet variance from currency movement alone – nothing to do with business performance.
Currency volatility affects both translation (consolidation) and transaction (entity-level) foreign exchange. Your UK parent invoices your US subsidiary £100k for services. US subsidiary records $127k expense at transaction date rate (GBP/USD 1.27). By month-end, when US subsidiary pays, rate moves to 1.30. US subsidiary pays $130k for a £100k liability – that’s a $3k transaction loss in US subsidiary’s P&L.
Then consolidation translation applies. US subsidiary’s P&L shows a $3k transaction loss plus all other results in USD. These translate at average rate to GBP for consolidated P&L. US subsidiary’s balance sheet translates at closing rate. Translation differences accumulate in consolidated equity as cumulative translation adjustment.
Managing currency risk requires:
- Hedging programs for significant exposures using forwards, options, or natural hedges
- Constant currency reporting for management alongside GAAP-required translated figures
- Sensitivity analysis showing impact of 5-10% currency swings on consolidated results
- Regular rate updates to consolidation systems, capturing current market rates
Recomputing translations manually becomes more fragile as currencies move and workbooks evolve. That’s why many global groups shift FX handling into systems that update rates automatically and flag material movements early, rather than discovering surprises at month-end.
2. Data Standardisation Across Systems
Your UK entities use Xero. Your US subsidiary runs QuickBooks. Your Australian entity operates NetSuite. Each system has a different chart of accounts structures, dimensions, and data models. Consolidation requires mapping all three to a unified group chart of accounts.
Your UK Xero account codes use a 4-digit structure: 4010 = Revenue – Consulting. Your US QuickBooks uses names: “Consulting Income.” Your Australian NetSuite uses 6-digit codes: 410100 = Professional Services Revenue. You need all three mapped to group code 4010 – Revenue – Consulting.
Mapping tables document these relationships:
- UK Xero 4010 → Group 4010
- US QuickBooks “Consulting Income” → Group 4010
- AU NetSuite 410100 → Group 4010
When your UK entity posts revenue to Xero code 4010, consolidation software knows to include this in Group Code 4010. When your US entity posts to “Consulting Income,” it flows to the same group line.
This sounds straightforward for one account. Multiply across 200 P&L accounts, 150 balance sheet accounts, and 8 dimension tags (department, region, project, customer). Your mapping tables contain 2,800 rows (350 accounts × 8 dimensions). One incorrect mapping creates a consolidated misstatement.
Chart of accounts harmonisation helps but rarely achieves perfection. Entities need local chart flexibility for statutory reporting.
- Your UK entity needs VAT account codes required by HMRC.
- Your US entity needs sales tax accounts for each state.
- Your Australian entity needs GST codes for ATO reporting.
These local requirements don’t map cleanly to a single group chart.
Consolidation databases with built-in mapping engines store these relationships and flag unmapped accounts automatically. When your US subsidiary adds a new account in QuickBooks, consolidation alerts you that “Consulting Income – New Service Line” has no group mapping. You map it once; future transactions flow to the correct consolidated line automatically.
3. Elimination Mismatches
Intercompany transactions should mirror: your UK parent’s £100k receivable should match your Singapore subsidiary’s £100k payable (translated from SGD). In practice, timing differences, currency fluctuations, and booking errors create mismatches.
- Timing Differences: UK parent invoices Singapore on 28 January. Singapore receives invoice on 3 February and posts it in February. January consolidation shows UK receivable with no matching Singapore payable. February shows both, plus January’s receivable is still outstanding. The solution: accrual adjustments at month-end for in-transit intercompany transactions, or waiting until both entities record before eliminating.
- Currency Translation: UK parent’s £100k receivable translates to £100k (it’s already GBP). Singapore’s SGD 170k payable translates to £102k at January closing rate. That’s a £2k mismatch from FX movement between invoice date and month-end. The £2k difference flows to consolidated P&L as realised/unrealised FX gain/loss on intercompany balance.
- Booking Errors: UK posts invoice to Singapore entity “Singapore Pte Ltd.” Singapore posts invoice as from “UK Parent Ltd.” Your elimination rules look for exact entity matches. No match found. Both balances remain in consolidated accounts, creating an overstatement. The solution: standardised intercompany entity codes enforced in all systems, or fuzzy matching logic that catches minor naming variations.
These mismatches require investigation monthly. For a group with 45 intercompany pairs, you’re checking 45 reconciliations each close. Manual reconciliation in Excel means comparing entity Trial Balances line-by-line, noting differences, investigating causes, posting adjustment journals. One senior accountant can spend 3-4 days monthly on intercompany reconciliation alone.
Automated consolidation with transaction-level intercompany tracking identifies mismatches automatically. When an intercompany invoice is posted, mismatches can be surfaced by your configured rules (for example: missing counterpart entries, timing gaps, or FX-driven differences), so issues are flagged earlier than month-end. Many mismatches self-resolve (Singapore posts late). Genuine errors surface immediately rather than at month-end.
4. Audit Trail Documentation
External auditors require evidence that consolidation is accurate, complete, and compliant with accounting standards. This means documenting:
- What was consolidated: Trial Balances from each entity, with reconciliation to entity statutory accounts
- Translation rates used: Closing rates, average rates, historical rates for equity, with sources
- Policy adjustments made: Journals aligning entity accounting to group policies, with calculations
- Eliminations applied: Intercompany transaction detail showing what was eliminated and why
- Management judgements: Goodwill impairment assessments, fair value estimates, control determinations
Manual Excel consolidation provides limited audit trail. Excel shows the results (consolidated TB, P&L, Balance Sheet) but not the detailed workings. Auditors need to see:
- Which cells contain management input vs formula calculations
- Who changed consolidation assumptions and when
- Prior period versions for comparative analysis
- Source data supporting each material balance
When auditors ask, “Why did consolidated revenue increase 15%?”, you need to show:
- Entity-level revenue movements (UK +£2m, US +$1.5m, AU +AUD 500k)
- FX impact on translation (£300k from currency movements)
- Elimination impact (intercompany sales up £200k, eliminated)
- Acquisition impact (new Singapore entity added £1m)
Excel makes drill-down painful. A controlled consolidation database can provide governed drill-down, change logs, and reproducible reconciliations from consolidated totals back to entity trial balances and journals – without relying on fragile workbooks.

Why Manual Excel Consolidation Fails for Global Groups
Excel works adequately for domestic groups with 3-5 entities in one currency. Beyond 10 entities or adding multiple currencies, Excel limitations create increasing risk and effort.
Formula Complexity and Breakage
Each entity needs its own worksheet tab. Consolidation formulas pull from entity tabs, apply FX rates from a separate rates table, reference mapping tables for chart of accounts alignment, and calculate eliminations from intercompany transaction sheets.
A formula pulling UK revenue from entity sheet, translating to presentation currency, and eliminating intercompany might look like:
=(UK!$C$15 * Rates!$B$10) – SUMIFS(Eliminations!$E:$E, Eliminations!$A:$A, “UK”, Eliminations!$B:$B, “Revenue”)
That’s for one account in one entity. Multiply across 350 accounts and 20 entities: 7,000 formulas. Each formula references multiple sheets. One person inserts a column in the UK entity sheet, shifts all column references, breaks 350 formulas. Consolidation returns #REF! errors. You spend 2 hours finding and fixing broken references.
Version control becomes impossible. Three people working on consolidation simultaneously create merge conflicts. You email “Consolidation_Jan24_v3_FINAL_revised.xlsx” back and forth. Nobody knows which version is current. Audit trail disappears.
Currency Translation Errors
Manual currency translation means:
- Look up closing rate from source (Bank of England, OANDA, Bloomberg)
- Enter closing rate into Excel rates table
- Repeat for average rate
- Apply closing rate to balance sheet line items
- Apply average rate to P&L line items
- Calculate translation difference manually
- Post translation difference to OCI
Each step introduces error risk. One wrong rate entered, one formula pointing to the wrong cell, one equity line item mistakenly using average instead of historical rate – creates consolidated misstatement.
With 6 functional currencies (GBP, USD, EUR, AUD, SGD, CAD), you’re managing 12 rates monthly (closing and average for each). That’s 144 rate entries annually. At 1% error rate, you misstate 1-2 currency translations yearly. On £50m consolidated assets, 1% is £500k misstatement.
Automated FX handling uses configured exchange-rate tables in your SQL database, updated on a schedule (often daily). Period “closing” and “average” rates follow your group policy, and translations refresh consistently across all entities. Translation applies to the correct line items based on configured rules (balance sheet = closing, P&L = average, equity = historical). Translation differences flow to OCI automatically. No manual intervention. No formula errors.
Intercompany Reconciliation Burden
Intercompany reconciliation in Excel requires:
- Export each entity’s intercompany account balances
- Copy into the consolidation workbook
- Translate foreign currency balances to presentation currency
- Match payables to receivables across entities
- Investigate mismatches
- Adjust for timing and FX differences
- Calculate elimination entries
- Post elimination journals
For 20 entities with 45 intercompany pairs, this process takes 3-5 business days monthly. Senior accountants spend 15-20% of their time reconciling intercompany accounts rather than analysing results or supporting business decisions.
Automated intercompany matching compares transaction-level detail. When UK parent invoices Singapore £50k, that specific invoice tracks through both systems. At month-end, consolidation matches UK invoice #12345 to Singapore bill #67890. If Singapore hasn’t received the invoice, the mismatch flags immediately with specific transaction reference (not just “£50k unexplained difference”). Investigation focuses on one transaction, not line-by-line account reconciliation.
No Real-Time Visibility
Excel consolidation is period-end only. You wait until all entities close, submit Trial Balances, and pass audits before starting consolidation. That’s 5-10 business days into the following month for most groups. Board meetings on the 15th receive financial results from month-end 15 business days prior. Management makes decisions based on 2-3 week-old data.
Automated consolidation with live data connections provides continuous visibility. Your Australian entity closes Friday evening. Data syncs to consolidation overnight. Monday morning, your UK CFO sees preliminary consolidated results, including Australia’s Friday close – 2 business days old, not 15 business days old.
Near real-time consolidation means spotting issues early. Your Singapore entity’s gross margin drops 3 percentage points in week 2 of the month. You investigate immediately – pricing error, inventory write-off, or genuine business issue? Near real-time visibility gives you 3 weeks to respond. Month-end discovery gives you no time – the month is over, results are set, you’re explaining to the board why margin missed target.
How Automated Consolidation Solves Global Challenges
A database-backed consolidation layer, integrated with entity accounting systems via APIs, addresses the manual limitations of spreadsheet-based consolidation.
Multi-Entity, Multi-Currency Architecture
Each entity’s accounting system (for example, Xero or QuickBooks Online) connects to a central SQL consolidation database via connector/API. Other systems can be added via the connector catalogue or a custom build where required. Data flows continuously or on scheduled refresh (hourly, daily, or near real-time, depending on requirements).
Your UK Xero posts a journal at 2 pm GMT. Within minutes, that journal syncs to consolidation database. Your US QuickBooks posts an invoice at 9 am PST (5 pm GMT). Syncs immediately. Your Australian NetSuite closes month-end at 5 pm AEDT (6 am GMT). Syncs overnight while UK team sleeps.
The database stores entity data in functional currency (as recorded) plus presentation currency (translated). Your US subsidiary’s $2m revenue records as:
- Functional currency: 2,000,000 USD
- Presentation currency: 1,562,500 GBP (at average rate 1.28)
- Translation rate used: 1.28
- Translation date: Average for the period
When exchange rates update, presentation currency recalculates automatically. If the average rate is revised from 1.28 to 1.29, US revenue retranslates to 1,550,387 GBP. Translation difference flows to cumulative translation adjustment. No manual formula updates. No broken cell references.
Automated Currency Translation
Currency rates can be sourced from a reliable FX provider (for example, central bank published rates or a market data provider), with the group policy defining the “closing rate” and the method for calculating average rates.
Translation rules configure once:
- Balance sheet accounts → closing rate
- P&L accounts → average rate
- Equity accounts → historical rate (stored at transaction date)
- Translation differences → cumulative translation adjustment in OCI
These rules apply automatically to every entity’s Trial Balance in every period. Your Singapore subsidiary in SGD, your US subsidiary in USD, your Australian entity in AUD – all translate following the same rules without manual intervention.
Historical rates for equity items store at transaction date. When your US subsidiary issued $1m share capital 5 years ago at GBP/USD 1.35, that translates to £741k once and stays at £741k forever. The database stores the historical rate and date. No risk of accidentally retranslating equity at current rates.
Configurable Elimination Rules
Intercompany eliminations are configured as business rules in the consolidation database:
Intercompany Revenue/Expense:
- IF Account = Revenue AND Entity = UK AND Customer = Singapore THEN eliminate against Singapore Cost of Sales where Vendor = UK
Intercompany Loans:
- IF Account = Loan Receivable AND Entity = UK AND Debtor = US THEN eliminate against US Loan Payable where Creditor = UK
Unrealised Profit:
- IF Account = Inventory AND Entity = UK AND Supplier = US AND markup = 25% THEN eliminate 25% from UK Inventory AND US Gross Profit
These rules execute each period automatically. When your UK entity posts new intercompany revenue, the elimination rule identifies and eliminates it without manual intervention. No Excel formulas to update. No risk of forgetting to eliminate new intercompany relationships.
The system can also handle FX differences that arise when intercompany balances retranslate at different closing rates, posting the net effect according to your policy.
Audit Trail and Documentation
SQL databases provide complete audit trails meeting external audit requirements:
- User Activity Log: Every data change records user ID, timestamp, old value, new value, reason for change
- Version History: Compare current period consolidation to prior periods with full drill-down to source changes
- Source Data Retention: Original entity Trial Balances stored with translations, adjustments, and eliminations visible separately
- Review Evidence: Adjustments and eliminations retain user/time/rationale metadata and supporting notes so reviews and approvals are auditable (your approval process can be enforced via your controls/workflow)
Auditors typically care less about the tool and more about the controls and evidence:
- Access controls
- Change logs
- Approvals
- Version history
- Ability to trace consolidated numbers back to source TBs and journals
A database-backed approach can make that traceability easier (for example, through immutable logs and reproducible queries), but the audit approach will depend on your auditor and control environment.
This transforms audit from adversarial review to collaborative verification. Auditors verify that the rules, logic, and controls are appropriate. Once satisfied, they trust the system executes consistently – rather than testing 100 individual Excel formulas monthly.
Scheduled Refresh and Continuous Consolidation
Configure refresh schedules aligning to your month-end close calendar:
- Daily refresh during the month: Updates consolidated flash reports showing current performance
- Hourly refresh last 5 business days of the month: Captures late adjustments as entities finalise close
- On-demand refresh when entities pass period close: Immediately updates consolidated results
This keeps consolidated reporting up to date throughout the month and reduces the “all-at-once” scramble at close. Use daily/hourly refresh for flash reporting, then lock down final refresh and approvals as each entity completes close procedures.
How dataSights Enables Global Financial Consolidation
dataSights automates multi-entity, multi-currency consolidation for groups operating across borders. The platform can deliver board-ready management packs from the consolidated model first, then automate Excel-based reporting for finance teams, and finally scale into Power BI from the same governed dataset. That means you don’t rebuild logic for each reporting layer – translation, eliminations, and mappings stay consistent end-to-end. Each entity – whether running Xero, QuickBooks, NetSuite, or another accounting system – connects to a central consolidation database. Data syncs on your schedule: hourly, daily, or near real-time.
This short walkthrough shows how dataSights’ consolidation module handles auto-eliminations and general adjustments while keeping the group accounts balanced (including where FX differences land). It also shows the management reports experience – running consolidated P&L reports, comparing entities and tracking categories, switching adjustments on/off, and exporting to Excel or PDF. The video finishes with how these reports plug into Excel automation (Power Query / Office add-in), Power BI, and optional workflows like posting updates back into Xero.
Automated Multi-Currency Translation
Configure exchange rates once. Update them from API feeds or manual entry. dataSights applies IAS 21 translation rules automatically using your configured rate sources, so consolidated statements refresh without manual rate tables or workbook maintenance. Translation differences flow to OCI automatically. When month-end arrives, consolidated financial statements reflect current exchange rates without manual rate tables or formula updates.
Teams managing Xero consolidation across multiple currencies report that automated FX handling eliminates 2-3 business days of manual translation work monthly. Your US subsidiary’s USD Trial Balance translates to GBP presentation currency automatically. Your Australian entity’s AUD balances convert to GBP without manual intervention. Exchange rate volatility updates cascade through consolidated statements in minutes, not days.
Cross-Border Elimination Management
Intercompany eliminations between entities in different countries and currencies configure as business rules. Configure cross-border elimination rules once, and apply them consistently each period. The consolidation layer can surface timing mismatches and FX-driven differences automatically, reducing manual reconciliation work at close.
Unrealised profit eliminations on cross-border inventory sales calculate automatically from transaction details. Your US subsidiary sells to your UK parent at 20% markup. UK hasn’t resold externally by month-end. The markup eliminates from consolidated inventory and gross profit without manual journal entries or Excel worksheets tracking intercompany profit margins.
Consolidated Trial Balance Foundation
Every consolidation starts with entity-level Trial Balances, not summary figures. dataSights pulls complete Trial Balance detail from each entity’s accounting system. This means consolidated financial statements drill down to source transactions in the original entity, original currency, with full translation and elimination visibility.
When consolidated “Legal & Professional Fees” shows unexpected variance, you trace to see your Singapore entity recorded SGD 80k in legal expenses (£48k translated) related to a contract dispute. You see the source transaction, the SGD amount, the GBP translation, and how it flows to consolidated P&L. Manual Excel consolidation provides only the consolidated total – no transaction-level visibility without returning to entity accounting systems.
Compliance with IFRS 10 and ASC 810
Consolidation rules align with IFRS 10 (for UK and international groups) or ASC 810 (for US parent companies).
- Define your consolidation scope (which entities consolidate vs equity-accounted) based on IFRS 10 / ASC 810 judgments.
- Configure the model so consolidation, eliminations, and reporting follow that scope consistently, with audit trail and change history on consolidation logic and adjustments.
Currency translation follows IAS 21 requirements:
- Functional currency determination
- Translation rate application (closing for balance sheet, average for P&L, historical for equity)
- Cumulative translation adjustment treatment in OCI
Policy adjustments align entity accounting to group standards as required by IFRS 10. All adjustments track with a full audit trail for external audit review.
For groups operating in multiple jurisdictions with differing accounting frameworks, configure policy alignment adjustments that convert local GAAP (US GAAP, Australian Accounting Standards, local statutory requirements) to group reporting standards. Your US subsidiary’s goodwill amortisation (permitted under US GAAP) is eliminated in consolidated accounts (IFRS requires impairment-only). The adjustment exists only in consolidation workpapers – US subsidiary’s statutory accounts remain unaffected.
From Weeks to Days: Real Performance Improvements
Finance teams managing global operations report tangible consolidation improvements after automating. Manual Excel-based consolidation for 20 entities across 6 countries typically takes 15+ business days from last entity close to final board pack delivery. That’s:
- 5 business days waiting for last entity to finalise and submit Trial Balance
- 3 business days on currency translation and chart of accounts mapping
- 4 business days on intercompany reconciliation and elimination calculation
- 3 business days on consolidation journals, variance analysis, and board pack preparation
Automated consolidation reduces this to under 5 business days:
- 2 business days for entities to finalise close (unchanged – this is entity-level work)
- Minutes for automated translation and elimination processing
- 2-3 business days for variance analysis, management commentary, and board pack finalisation
The time savings concentrate on mechanical consolidation work (translation, eliminations, reconciliation) rather than value-add analysis. CFOs gain days to investigate variances, prepare management commentary, and support board discussions – instead of validating Excel formulas and reconciling intercompany accounts.
Groups handling 40+ entities report even more dramatic improvements. Manual consolidation becomes impractical at this scale. Automated systems with multi-entity capability handle both small groups (5 entities) and large international operations (100+ entities) without performance degradation or manual effort scaling.
Frequently Asked Questions
What’s the Difference Between Multinational and Multi-Entity Consolidation?
Multinational consolidation specifically addresses challenges of entities operating in different countries: multiple currencies requiring translation under IAS 21, cross-border intercompany transactions with FX impacts, varying local accounting standards requiring policy alignment, and multi-jurisdictional regulatory compliance. Multi-entity consolidation can occur entirely within one country and one currency, avoiding these complexities. A UK group with 10 UK entities handles multi-entity consolidation but not multinational. A UK group with operations in the US, Australia, and Singapore manages multinational consolidation with full currency and regulatory complexity.
Do All Entities Need the Same Accounting Software for Consolidation?
No. Consolidation occurs outside entity accounting systems by aggregating Trial Balances from whatever software each entity uses. Your UK entities can run Xero, while your US subsidiary uses QuickBooks and your Australian entity operates NetSuite. Consolidation requires mapping each system’s chart of accounts to a unified group structure, but the underlying entity software doesn’t need to match. API connectivity to each system enables automated data extraction regardless of platform.
How Do You Handle Different Fiscal Year-Ends in Global Consolidation?
IFRS permits limited differences in reporting dates for subsidiaries, and IAS 28 permits similar timing differences for associates/joint ventures – provided the gap is no more than three months and you adjust for significant intervening transactions. If your UK parent has a December year-end and an investee has a March year-end, use financial information aligned to December where practicable, or use the nearest period-end and adjust for significant Jan-Mar movements (and keep the lag consistent each period).
Can You Consolidate if Subsidiaries Use Different GAAP Frameworks?
Yes, with policy alignment adjustments. IFRS 10 requires uniform accounting policies across the group. If your US subsidiary follows US GAAP and your UK parent applies IFRS, convert the US subsidiary’s accounts to IFRS for consolidation purposes through adjustment journals. Common adjustments include goodwill treatment (US GAAP permits amortisation, IFRS requires impairment-only), lease accounting differences pre-IFRS 16 adoption, and revenue recognition timing. These adjustments sit in consolidation workpapers – the US subsidiary’s statutory accounts continue following US GAAP for SEC compliance.
What Exchange Rates Do You Use for Goodwill Translation?
Goodwill recognised on acquiring a foreign operation is treated as part of that foreign operation’s net assets and is translated at the reporting date closing rate each period. For example, if you paid £10m for a US subsidiary with goodwill of £2m recognised at acquisition, that goodwill is translated each period using the current GBP/USD closing rate. This differs from the historical-rate treatment applied to equity items because goodwill is an asset arising from the acquisition, not equity. Translation differences on goodwill are included in the cumulative translation adjustment in OCI, along with other foreign operation translation differences. IAS 21 explicitly treats goodwill and fair value adjustments arising on acquisition of a foreign operation as assets and liabilities of the foreign operation, translated at the closing rate.
How Do You Consolidate Entities With Non-Controlling Interest?
Include 100% of the subsidiary’s assets, liabilities, revenue, and expenses in consolidated statements. Present the non-controlling interest (NCI) portion separately in consolidated equity (balance sheet) and consolidated profit (income statement). If you own 70% of a subsidiary with £5m net assets and £800k annual profit after eliminations, consolidated balance sheet shows £5m total equity with £1.5m (30%) attributed to NCI. Consolidated income statement shows £800k profit with £240k (30%) attributed to NCI. NCI allocation occurs after intercompany eliminations – not before.
What Happens to Cumulative Translation Adjustment When You Sell a Foreign Subsidiary?
The cumulative translation adjustment (CTA) accumulated in consolidated equity reclassifies to consolidated profit or loss on disposal. If you sell your US subsidiary and consolidated equity contains a £500k debit balance in CTA related to that subsidiary, the £500k reclassifies from equity to P&L as part of the disposal gain/loss calculation. This “recycles” translation differences through profit when the foreign operation no longer exists. While you own the subsidiary, translation differences remain in equity. On disposal, they affect reported gain/loss on sale.
How Do You Handle Transfer Pricing in Consolidation?
Transfer pricing affects profit allocation between entities for tax purposes but doesn’t change consolidation mechanics. If your UK parent charges your Singapore subsidiary £100k for services and tax authorities require arm’s length pricing of £120k, the tax adjustment occurs at entity level (Singapore records £120k expense for tax, £100k for accounting). Consolidation eliminates the £100k intercompany transaction in GAAP accounts. Tax consolidation separately tracks the £120k transfer pricing adjustment for tax provision calculation. Transfer pricing impacts tax expense but doesn’t change underlying consolidation eliminations.
Can You Consolidate Real-Time or Does It Require Month-End Close?
You can run real-time “flash” consolidation for management visibility if systems sync continuously, but formal reporting still depends on entity close quality (accruals, reconciliations, cut-off). Many groups use both: intra-month flash views and a controlled post-close consolidation for board and audit.
Do Auditors Accept SQL Database Consolidation Instead of Excel Workpapers?
Auditors typically focus on controls and evidence, not the tool itself: access controls, change logs, approvals, version history, and the ability to trace consolidated numbers back to source trial balances and journals. A database-backed approach can make that traceability easier, but expectations vary by auditor and depend on your control environment.
Transform Manual Global Consolidation Into Automated Group Reporting
Global financial consolidation across multiple entities, currencies, and jurisdictions doesn’t have to mean long close cycles and fragile workbooks. When translation, eliminations, and policy adjustments run from a governed consolidation layer, the close becomes faster, more consistent, and easier to audit. That frees your team to spend close time on variance analysis and commentary, not formula checks and rework. If you want to shorten the close without sacrificing control, automation is the fastest lever you can pull.
Automate Your Global Financial Consolidation With dataSights
Ready to move toward a ~5-business-day group close? dataSights automates multi-entity, multi-currency consolidation so customers regularly cut their close from more than 15 days to around 5, while improving control and auditability. Join 300+ businesses that have transformed consolidation from manual, effort-heavy close cycles into automated, auditable processes. Rated 5.0 by 77+ Xero users managing multi-country operations.
About the Author
Kevin Wiegand
Founder & Client happiness
I’m Kevin Wiegand, and with over 25 years of experience in software development and financial data automation, I’ve honed my skills and knowledge in building enterprise-grade solutions for complex consolidation and reporting challenges. My journey includes developing custom solutions for data teams at Gazprom Marketing & Trading and E.ON, before founding dataSights in 2016. Today, dataSights helps over 250 businesses achieve 100% report automation. I’m passionate about sharing my expertise to help CFOs and Financial Controllers reduce their month-end close time and eliminate the manual Excel exports that drain their teams’ valuable time.