
If you are a service based firm, especially with part of your revenue being fixed price/value based, then welcome to my post about Realisation%.
In order to help focus a staff member’s performance, there is one major question we can be asking;
“Of their chargeable capacity this month, how much did they actually invoice?”
But why are we asking this, why does it matter, why do we care?
1) People can be busy (utilisation), but are those hours being converted into income (absorption)?
2) It’s very applicable to service organisations implementing fixed price / value based pricing
3) Provides the means to track the ‘least hours for highest return’ employees. High performing employees do less to generate more.
4) The ability to engage all staff about performance, without exposing margins or profits.
The calculation we are referring to is Realisation% or Absorption%. I heard about it from an ex-big 4 consultant and MD of a number of agencies. I’ve implemented it at a client with fantastic results. Some of their partners’ Realisation% have increased by over 50% in just a couple of months, simply by making it visible to the staff. As you will see, Billable% (utilisation%) by itself can be relatively useless as a KPI.
Although there are a number of scenarios we could highlight using examples, let’s just focus in on two scenarios;
Scenario 1 – ‘Underperforming’
This occurs more often in fixed price contract work where not all hours are absorbed. Utilisation% KPI looks good, but chargeable capacity is not being converted at the required rate

Scenario 2 – High value staff member
Here Kim is taking less time to do the work than what it has been sold for. Amazing work, now she can do some more fee earning. If you were only looking at Utilisation% as a KPI that wouldn’t be very smart would it!
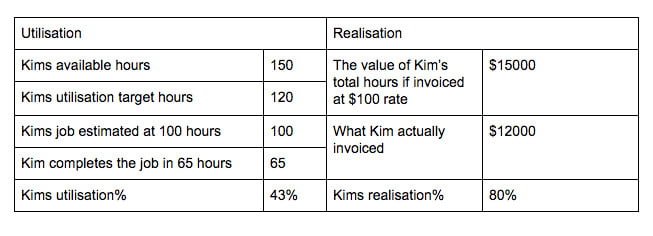
Calcuations for reference;
Realisation% = Staff member hours available per month x staff rate / Amount invoiced by the staff member
Utilisation% = Time recorded against client work / Time recorded
In summary;
An overt focus on time can kill team culture, however, using Realisation% can help teams see this data as a positive and innovate to improve.
I literally love how individual firms goals differ based on their staffing models, operational models and owner/director/manager touches to boot. This means the metrics they want to see usually completely differ. Our only goal at dataSights is to help you visualise the KPIs and metrics that align with your company goals. There is no right and wrong, only what works for your service based business and what’s driven by your data.
Client example;
Here is an example of a staff members dashboard with both Utilisation% (Billable%) and Realisation% that we implemented for a client in the past few months.
Kevin Wiegand
+61 481 501763