Quantum Advisory (Quantum) is an advisory team who help business owners supercharge their companies, become more profitable and plan for the future.
They have grown substantially in the last two years and have a distributed team of advisory, accounting, SMSF and bookkeeping staff.
When Matt Beattie, the General Manager of Quantum got in touch with me he wanted to achieve the following:
- Focus staff effort, aligning them with business performance goals
- Shine a light on performance
- Surface daily profitability across both Fixed Price Agreements (FPA) and Project work
- Automate existing Revenue reports, including Practice Ignition data
- Reports & dashboards that could be easily consumed and tailored to certain business areas
Quantum Advisory use the following systems to run their Operations;
- Practice Ignition
- Xero
- XPM
- HelpScout
- ToDoist
- Social Media
A smorgasbord of SaaS apps that can be turned into real-time metrics that can help Quantum run a better business… at dataSights this is what we live for!
We broke the project down into various phases;
Phase 1 : Automate existing ‘Revenue’ scoreboard
Phase 2 : Ops Dashboard
Phase 3 : Individual Accountant/Partner Dashboard
Phase 4 : Bookkeeper Dashboard – next part of the project!
Phase 5 : Social Media Dashboard – next part of the project!
Phase 1 : Automate existing ‘Revenue’ scoreboard
Purpose
The idea of this dashboard is to focus Quantum’s staff on revenues, daily. The focus for the month is to hit two forms of adjusted budgets. Both of these adjusted budgets are based on their Xero budget. I like the way the initial focus of Quantums reports is on revenue, targeting realistic and constantly adjusted team budgets. The profitability focus, later on, is also of mass importance, but without revenue targets, teams can lose sight of what they are working towards.
Data
This chart combines Practice Ignition and Xero data.
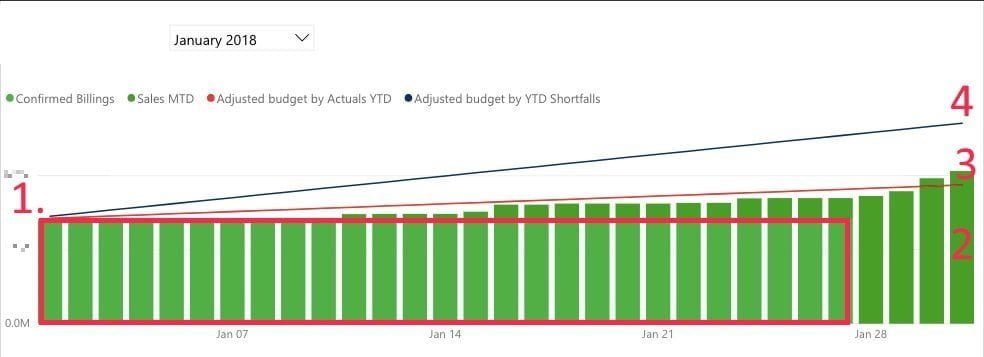
- Confirmed Billing data from PracticeIgnition (PI) which is adjusted by Quantum to remove Xero subs
- Xero Revenue post 28th of the month – which is realised PI + Advisory + Project revenue
- Adjusted Budget by Actuals – Xero budget adjusted with YTD earnings subtracted from remaining budgets
- Adjusted Budget by Shortfalls – Xero budget adjusted with YTD shortfalls
Unfortunately PI doesn’t yet have an API, but I’ve previously demoed to both Guy Pearson and Dane Thomas the founders of PI and firstly, both Guy and Dane are just too damn awesome for words and secondly, I have no doubt that when they do build an API it’s going to be the king of API’s.
The current Zapier integration however doesn’t quite give us all the Proposal/Contract events we need currently. So Matt puts the Confirmed Billings from PI into a Google Spreadsheet and we pull them down into Quantums database automagically. Not ideal, but we will rework getting this data from the PI API when that glorious day comes.
Phase 2 : Ops Dashboard
Purpose
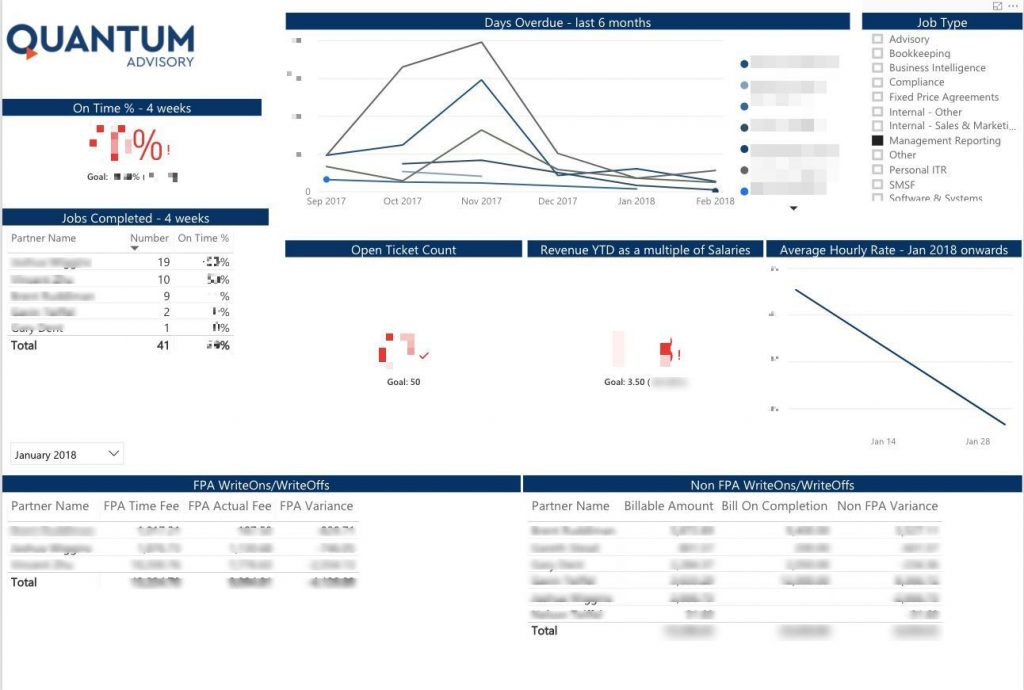
The goal here is to help Senior Management keep tabs on the metrics that will help them keep track of the company-wide goals they are aiming to achieve.
The overarching goal was to get an “Efficiency” / WriteOn or WriteOff view across both Fixed Price Agreements (FPA) & Project work. This sounds relatively straightforward but combining data from PI + XPM + Xero, creating the mapping “glue” as well as the data automation and visualisation bespoke to the Practices goals are not something SaaS tools offer. Every Xero Practice we have dealt with uses XPM in a slightly different way. For eg. Quantum run a separate job from the PI created tasks so they can better manage workflow for their FPA’s. This is more efficient for staff to work with on a daily basis but a bit painful to track profitability reporting easily. But now they have the best of both worlds; XPM jobs to manage FPA tasks and profitability reporting as a group or by accountant.
Quantum have only recently started tracking time, but for those firms that don’t want to track time, there are still applicable metrics here that can be used to gauge delivery and therefore client happiness and profitability.
Please NOTE: We are still in the process of creating high-level dashboards from these base reports. In fact, I won’t even show that each of the visulisations in these reports has an entire dedicated page for delving into how the calculations are created. So there is a large amount of information on these reports, but the idea is to surface only a few for general consumption but has the underlying reports ready for when questions about the data are asked.
Data
Xero + WorflowMax + HelpScout + Fixed Price Agreement Service split custom fields + Mapping data
This was our first integration with HelpScout. Great API, loved it and I can’t wait to have the need to use it in DataSights internally! The key though is that next on Quantums integration list is AskNicely which is an NPS SaaS tool which Quantum have automated into their workflow with Zapier. So whether its Freshdesk / Zendesk / NPS data, the idea is to have it all surfaced in one location that can either go on internal dashboards in the office or specific versions shared with different audiences within the organisation. In fact, if you want to share it with clients we can easily do that too.
Phase 3 : Individual Accountant/Partner Dashboard
Purpose
This report and the high-level dashboards for each accountant are simply meant to be a status update for each partner and help highlight certain areas that help both the individuals and practice achieve their goals.
There’s a ton of stuff on here, so I’ll focus on a few areas;
A correlation between OnTime% vs ROI Multiple
Reporting OnTime% is a good start, but so what. However if we correlate that with something financial like an ROI Multiple and we see the inverse relationship unfolding before us, then we all off a sudden start paying more attention. It’s clever.
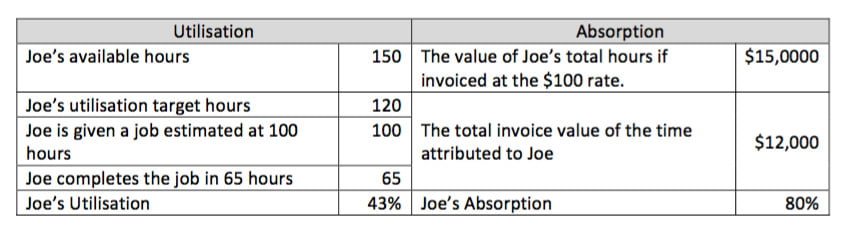
Realisation % (also called Absorption in manufacturing)
A massive personal favourite. It helps you track high-value staff and if you don’t track time then this metric definitely is for you. By achieving a Realisation% and Utilisation% of over 80%, I have it in good faith from a big four consultant that an EBIT of over 20% can be guaranteed. So we know what utilisation% is; am I working on client stuff according to timesheets, but what is realisation%?
Using the table below to illustrate, if we were only tracking utilisation% Joe would be in trouble. But actually, Joe has taken a lot less time to do the work than what it has been sold for. Go Joe! I’ll do another blog post on this but by keeping track of the staff members rate, their capacity and how much they invoice for in a given period, this metric is absolute gold.
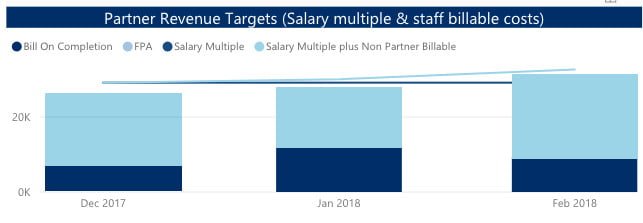
Accountant to junior Staff Leveraging
There’s a couple ways to skin this cat. Some Top Tier law firms enforce it as a KPI so Partners have to use junior staff. Quantum are cleverly encouraging what they have seen occurring in their business. They are using a similar but slightly different concept by saying; “Hey guys/girls, absolutely use junior staff, but, what we going to do is adjust your targets by the billable amount that you utilised of your junior team members”.
Simply put, the solid horizontal dark blue line below is the partner’s target of 3.5 times their monthly salary. If they use junior staff then the junior staff member’s billable time is added to the partner’s target which is why the second light blue line goes up a little bit some months.
Data
The only bit I want to mention here is that because of the DataSights solution and approach, we were able to augment the SaaS applications (PI, Xero, XPM, HelpScout) with data that is specific to Quantum. If your visualisations don’t have what you care about in them, it’s a pointless exercise.
So what’s next for Quantum + dataSights?
- Bookkeeping dashboard = XPM + ToDoist
- Adding NPS per accountant
- Client Service Matrix
- Client 80/20 report aka which client should we let go
- Tying Social Media efforts to financial returns
I seriously enjoy working with Matt Beattie the GM at Quantum and the most important thing is that Quantum are excited about their data and with every conversation I’m hearing more ideas on what they want out of their data and that is what it’s all about. It’s always a client journey not a client project for us!
To organise a demo please don’t hesitate to get in touch with me:
Kevin Wiegand
+61 481 501763