
Dalby General Steel is a family business that has been around for decades and is now run by Nolan Keen and is a one-stop shop for steel needs, building materials, and rural supplies in the Dalby region. Nolan has over 9k products in his business. He loves using DEAR to manage his inventory, however managing that many products is difficult without automation. And that’s where we step in!
The main reasons for getting us involved was for data automation to help Nolan not leave money on the table across his 9k product WRT to margin and also to help drive purchasing through historical pricing and forecasting
- Nolan wanted to know when he was making a loss on products.
- When prices needed updating, he could only do it one at a time, so wanted to automate this
- Nolan wanted someone in his team to make forecasting purchasing decisions based on historical sales
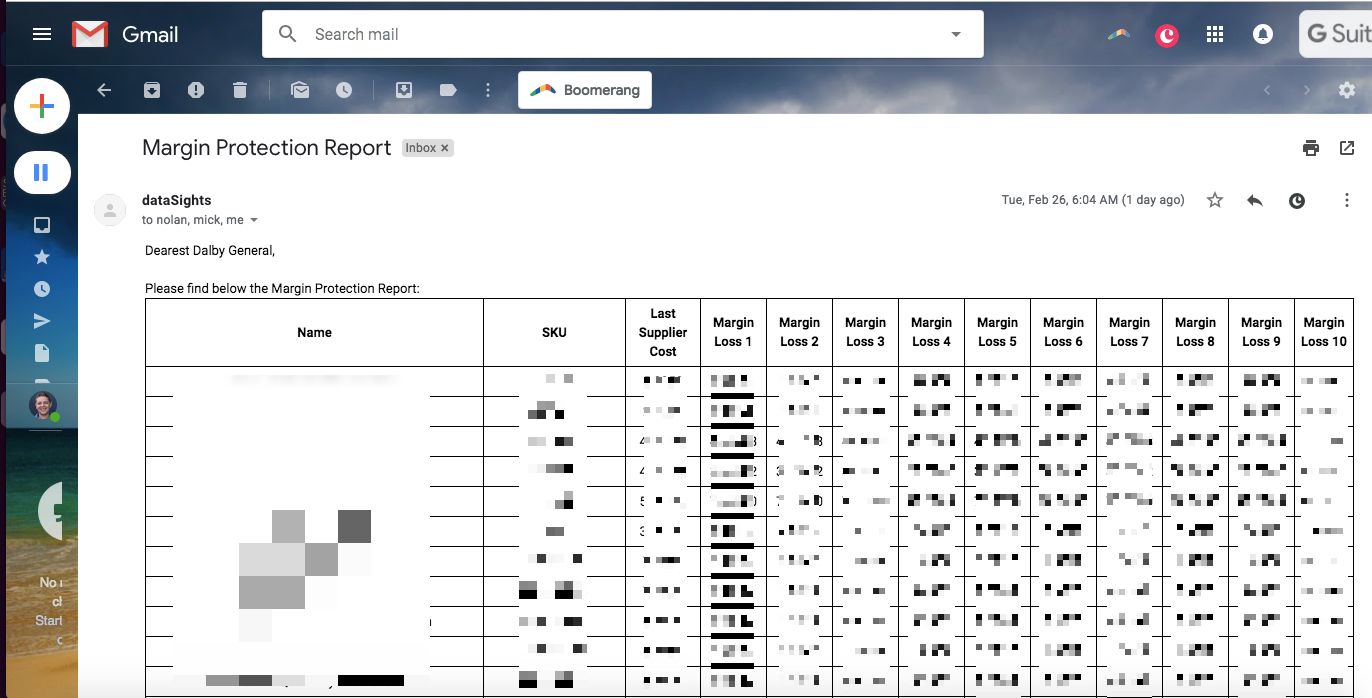
Margin Protection Email Report
Problem : “Are you leaving money on the table” these are Nolan’s words entirely
Solution : A daily email arrives at 6am in Dalby General’s inbox, telling them which products he is making a loss on. What we did was put a margin% per product in the additional attributes field. This is the key to us knowing what the ideal margin% per product is.
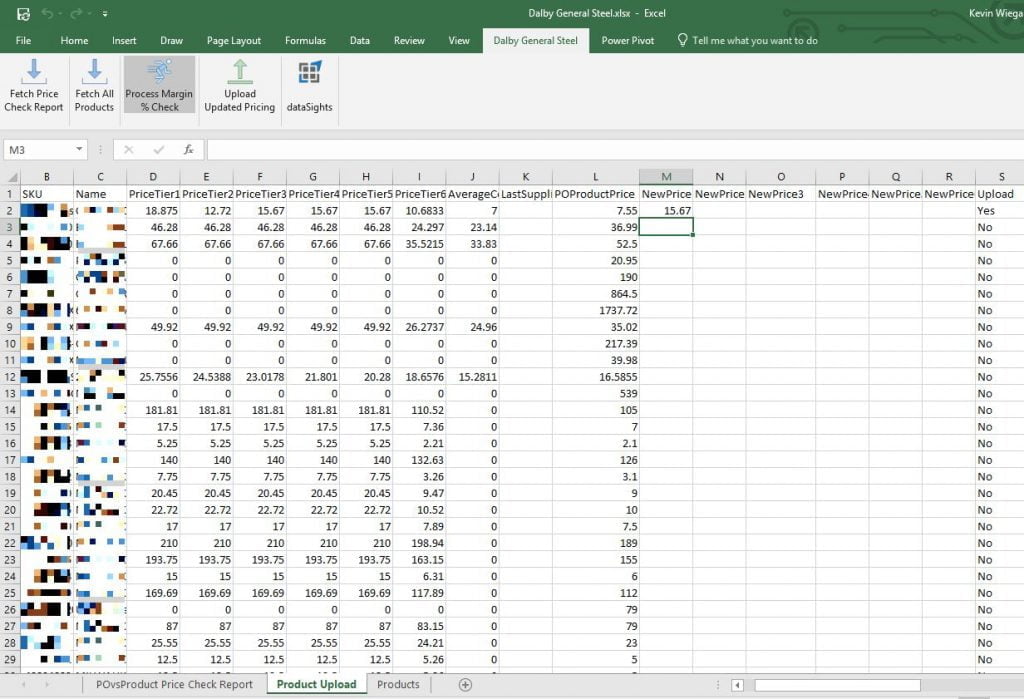
Update Prices in Bulk Automation with custom Excel AddIn
Problem : Once stock that needs to be updated is identified, then we need a way to update those prices in a few clicks. Also we need to make sure that Margin %’s are preserved
Solution :
1) Margin %’s for each product in AdditionalAttributes per product are uploaded as a once off exercise
2) We built an ExcelAddIn which highlights the products to be updated, and suggests a new price based on the stored Margin % and allows the uploading of 1000’s of products with three clicks.
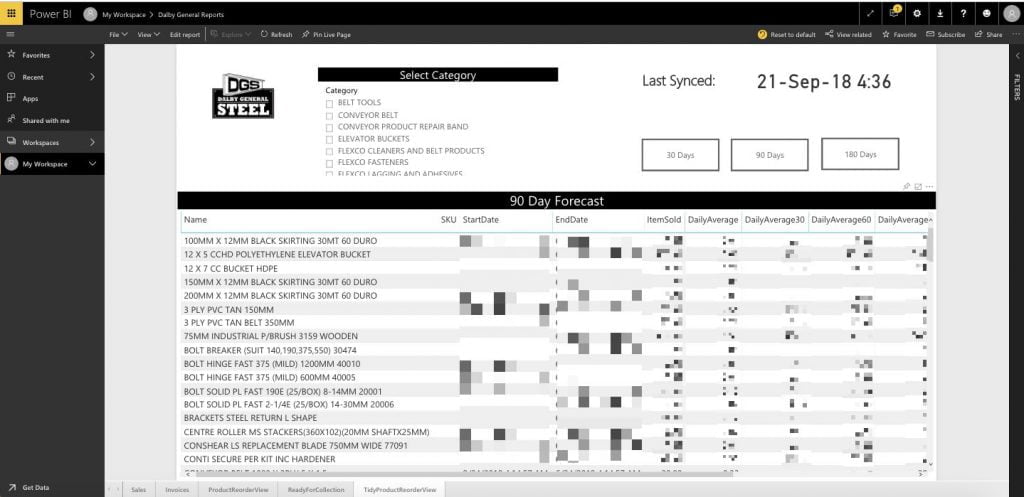
Forecasting purchasing based on historical sales
Goal : To easily allow the purchasing decisions for new stock to be made accurately
Solution :
An automated PowerBI report that allows the following;
1) Allow a category selection as each category of products have different cycles
2) Allow different date ranges to include historical sales; 30 days history, 90 days history, 180 days history
3) Calculate a daily average and then multiply out by 30, 60 and 90 days
A big thank you to Nolan for being such a great client on the journey so far. Plenty more to do around GP% reports and who knows what else.
If you have any questions or would like to have a chat about this solution or anything similar to do with data, then please give us a call!
kevinw@datasights.co
www.datasights.co